2275
Technical Committee 208 /
Comité technique 208
Artificial heavy rainfall was given as shown in Figure 3. The
rainfall intensity fluctuated due to restriction of water supply,
but around 500 mm of total of rain was applied in the first day,
and 700 mm was given in the second day.
Major deformation was observed in the second day, and the
slope failed progressively from the bottom with scarp angle of
40 to 50 degrees. The final shape of scarp is shown with thick
broken line in Figure 2.
Figure 4 shows the changes in tilting angles detected by the
tilt sensors due to the rainfall in the second day. Tilt angles of
the upper segment are shown for the miniature ground
inclinometers. The nearer to the bottom of slope, the more
tilting angles are observed. The tilting rate for each sensor is
between 0.1 and 0.5 degree / hour before failure. It is also
remarkable that K150-upper, 150 cm apart from the bottom of
slope, started to tilt slowly in the early stage, when the failure
was observed only at the bottom scarp. This suggests that the
sensor detected slight effects of the failure event at some
distance of the sensor position. This behaviour is not visible to
human eyes because its tilting rate was only 0.02 degree / hour.
Figure 5 shows the behaviours of the tilting angle of the
upper unit of the miniature inclinometer, K50, at 50 cm from
the bottom of slope. This represents the average shear
deformation of the soil layer between depth of 0 and 50 cm.
Besides, Figure 5 also shows the volumetric water content at a
depth of 50cm at a position of 50 cm from the bottom of slope.
The volumetric water content repeated to increase and decrease
corresponding to the intermissive rainfall and drainage stages.
Figure 6 plots the tilting angle versus the volumetric water
contents of Figure 5. This represents relationships between the
shear deformation and water content. The deformation increased
when the water content was high corresponding to rainfall,
although some additional deformation was also recorded due to
removal of soil which dropped and deposited in front of the
bottom of slope.
32
33
34
35
36
37
38
39
40
0
2
4
6
8
10
K50- upper
Tilting of upper 50cm (dX1) of miniature
inclinometer at 50cm from the bottom of slope.
Elapsed time (hour)
Tilting angle (deg)
2011/ 6/ 30- 08:00
32
33
34
35
36
37
38
39
40
0.10
0.15
0.20
0.25
0.30
Volumetric water content at depth of 50cm,
at 50cm from the bottom of slope.
Elapsed time (hour)
Volumetric water content
(m
3
/ m
3
)
2011/ 6/ 30- 08:00
W50- depth50cm
Figure 5 Time histories of tilting angles and volumetric water contents
at 50 cm from the bottom of slope.
0
1
2
3
4
5
6
7
8
9
1
0.12
0.14
0.16
0.18
0.20
0.22
0.24
0.26
0.28
0.30
0
Disturbance due to removal
of dropped deposit
Tilting of upper 50cm (dX1) of miniature inclinometer
and volumetric water content at depth of 50cm
at 50cm from the bottom of slope.
Volumet ric wat er cont ent (m
3
/ m
3
)
Tilting angle (degree)
Figure 6 Tilting angles versus volumetric water contents at 50 cm from
the bottom of slope.
A unique relation between the deformation and the water
content can be drawn as an envelope of the plot, as indicated in
Figure 6, which is independent of the time history of the
artificial rainfall. Similar behaviours was be also observed in
laboratory model tests on slip surface of unsaturated soil under
constant shear stress and cyclic water infiltration/drainage
processes (Uchimura et. al. 2011b).
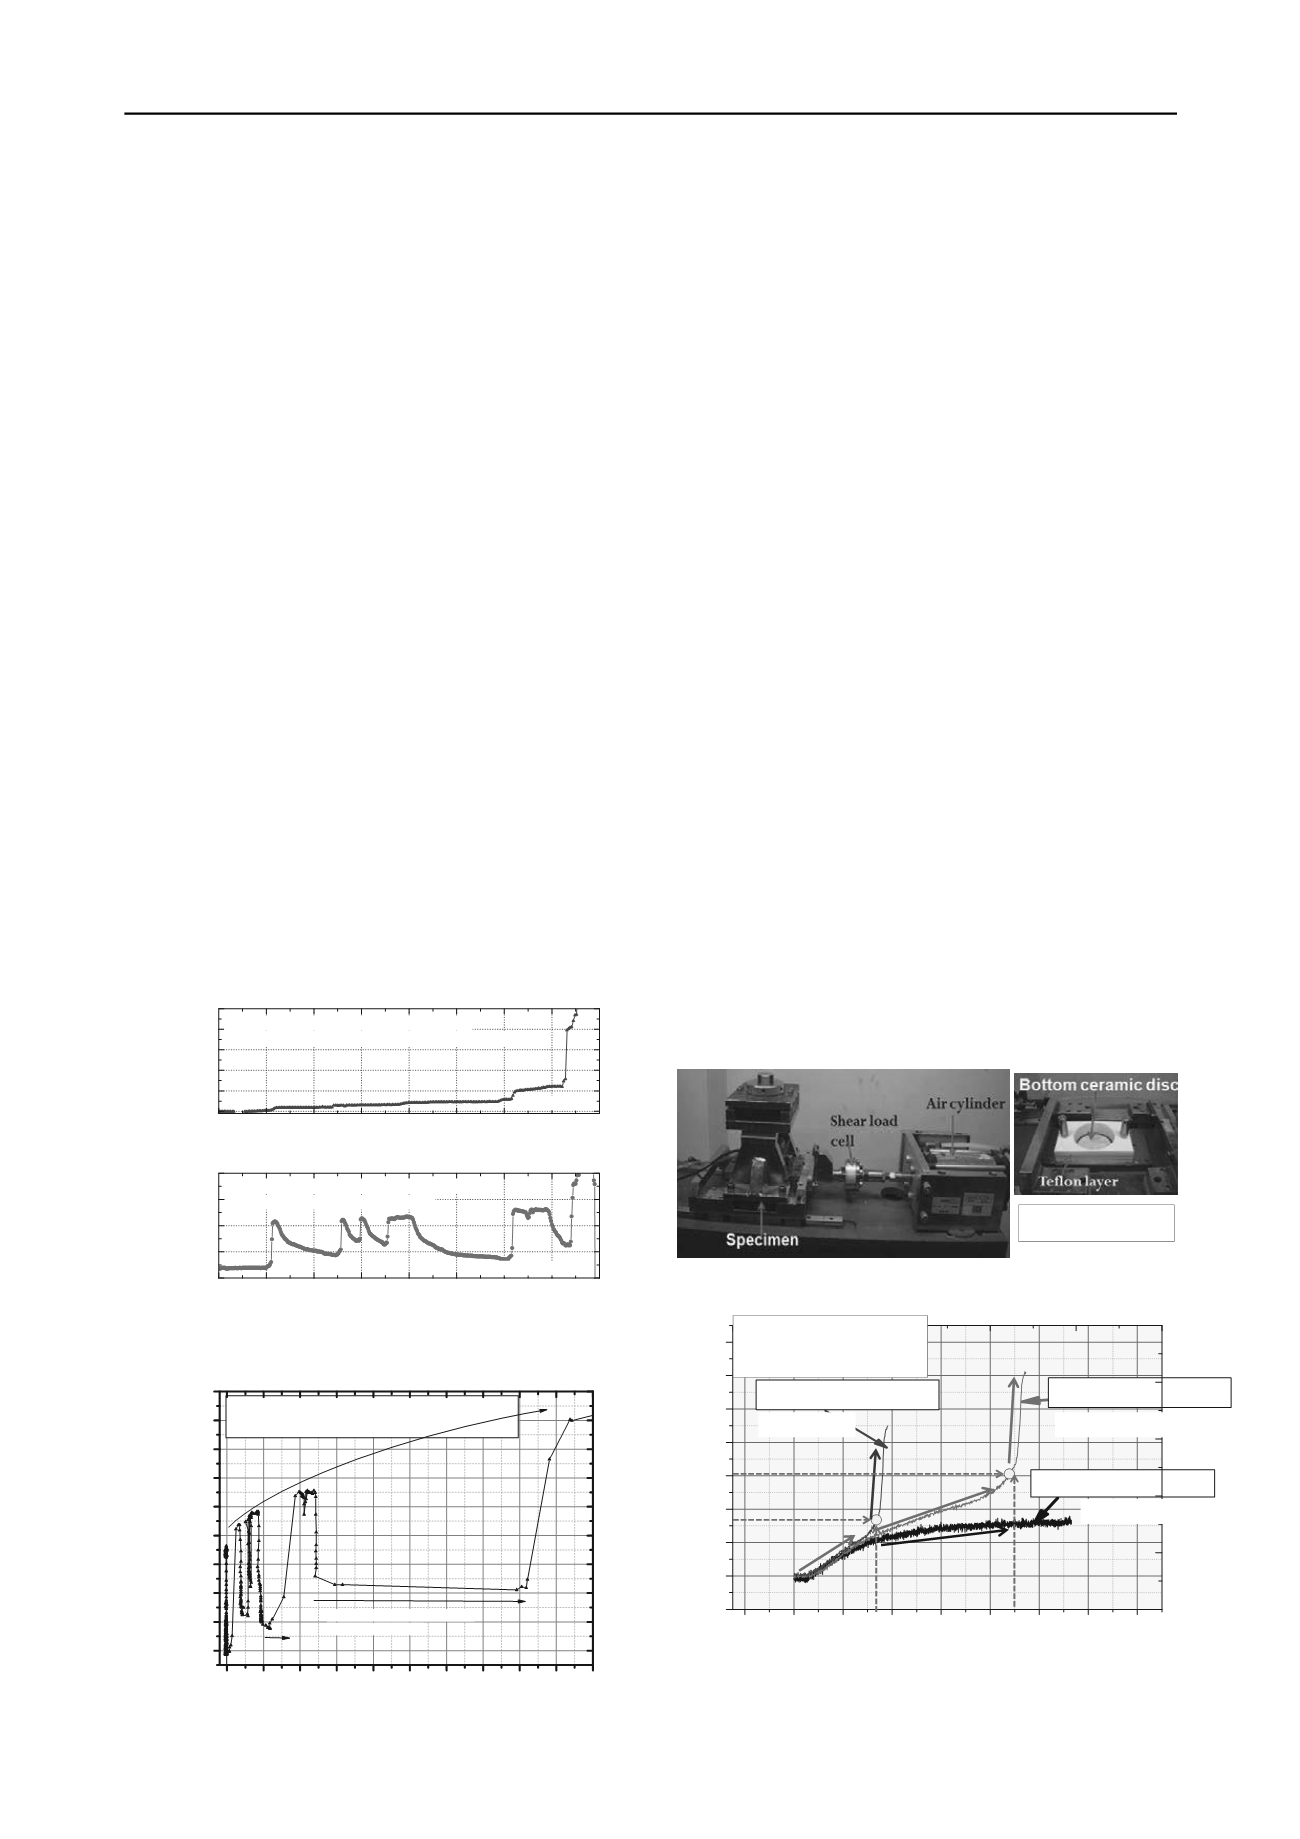
3 SIMPLE SHEAR TESTS ON SLIP SURFACE
A series of simple shear tests were conducted on unsaturated
sandy soil specimens to observe their prefailure behaviors more
precisely. Figure 7 shows the arrangement of the testing device.
Edosaki Sand (D
max
= 2 mm, D
50
= 0.23 mm, fine content = 6 %,
Gs = 2.665, e
max
= 1.685, e
min
= 0.578) was compacted into a
disc shape with a diameter of 60 mm and a height of 20 mm,
and a relative density of Dr = 70 % with initial volumetric water
content of 7 %. The specimen is surrounded by a stacked layers
made of Teflon, which has low friction coefficient, to reduce the
effect of friction. The specimen was loaded with 60 kPa of
vertical confining pressure. And then, 15, 24, 30 kPa of constant
shear stress was applied, which corresponds to 0.25, 0.4 and 0.5
of stress ratio, respectively. These three stress ratio simulate the
stress state on the slip surface for gentle, medium, and steep
slopes. Then, water was injected into the specimen from the top
and bottom surface through ceramic discs with a constant
injection rate of 310 ml/hr, which corresponds to a rainfall
intensity 110 mm/hr fall on the top area of the specimen.
Figure 8 shows the obtained volumetric water contents and
shear strain during the water infiltration process. It seems that
there are three patterns of deformation and failure processes. In
the case with stress ratio of 0.25 (gentle slope), the shear
deformation increases with water infiltration, but it converged
to a limited value not showing failure. On the other hand, in the
case of steep slope with stress ratio of 0.5, the strain started to
increase with a similar rate to that in the case of gentle slope,
but it suddenly yielded at incremental volumetric water content
of around 7 % and shear strain of around 1.7 %, followed by a
quick deformation with high strain rate.
Specimen size
:-Dia.6cm &
height2cm
Figure 7 Equipments for direct shear tests.
-4 0 4 8 12 16 20 24 28
-1
0
1
2
3
4
5
6
7
Shear strarain(%)
C hange o f vo lum e tric wa te r con ten t(% )
S tres s ra tio=0 .25
S tress ra tio=0 .4
S tress ra tio=0 .5
Normalstress=60Kpa,
Dr=70%
Initial vol. water cont.=7%
(Gentle slope)
(Steep slope)
(Mediumslope)
Figure 8 Shear strain versus volumetric water content under 3 values of
constant stress ratio.


