2267
Technical Committee 208 /
Comité technique 208
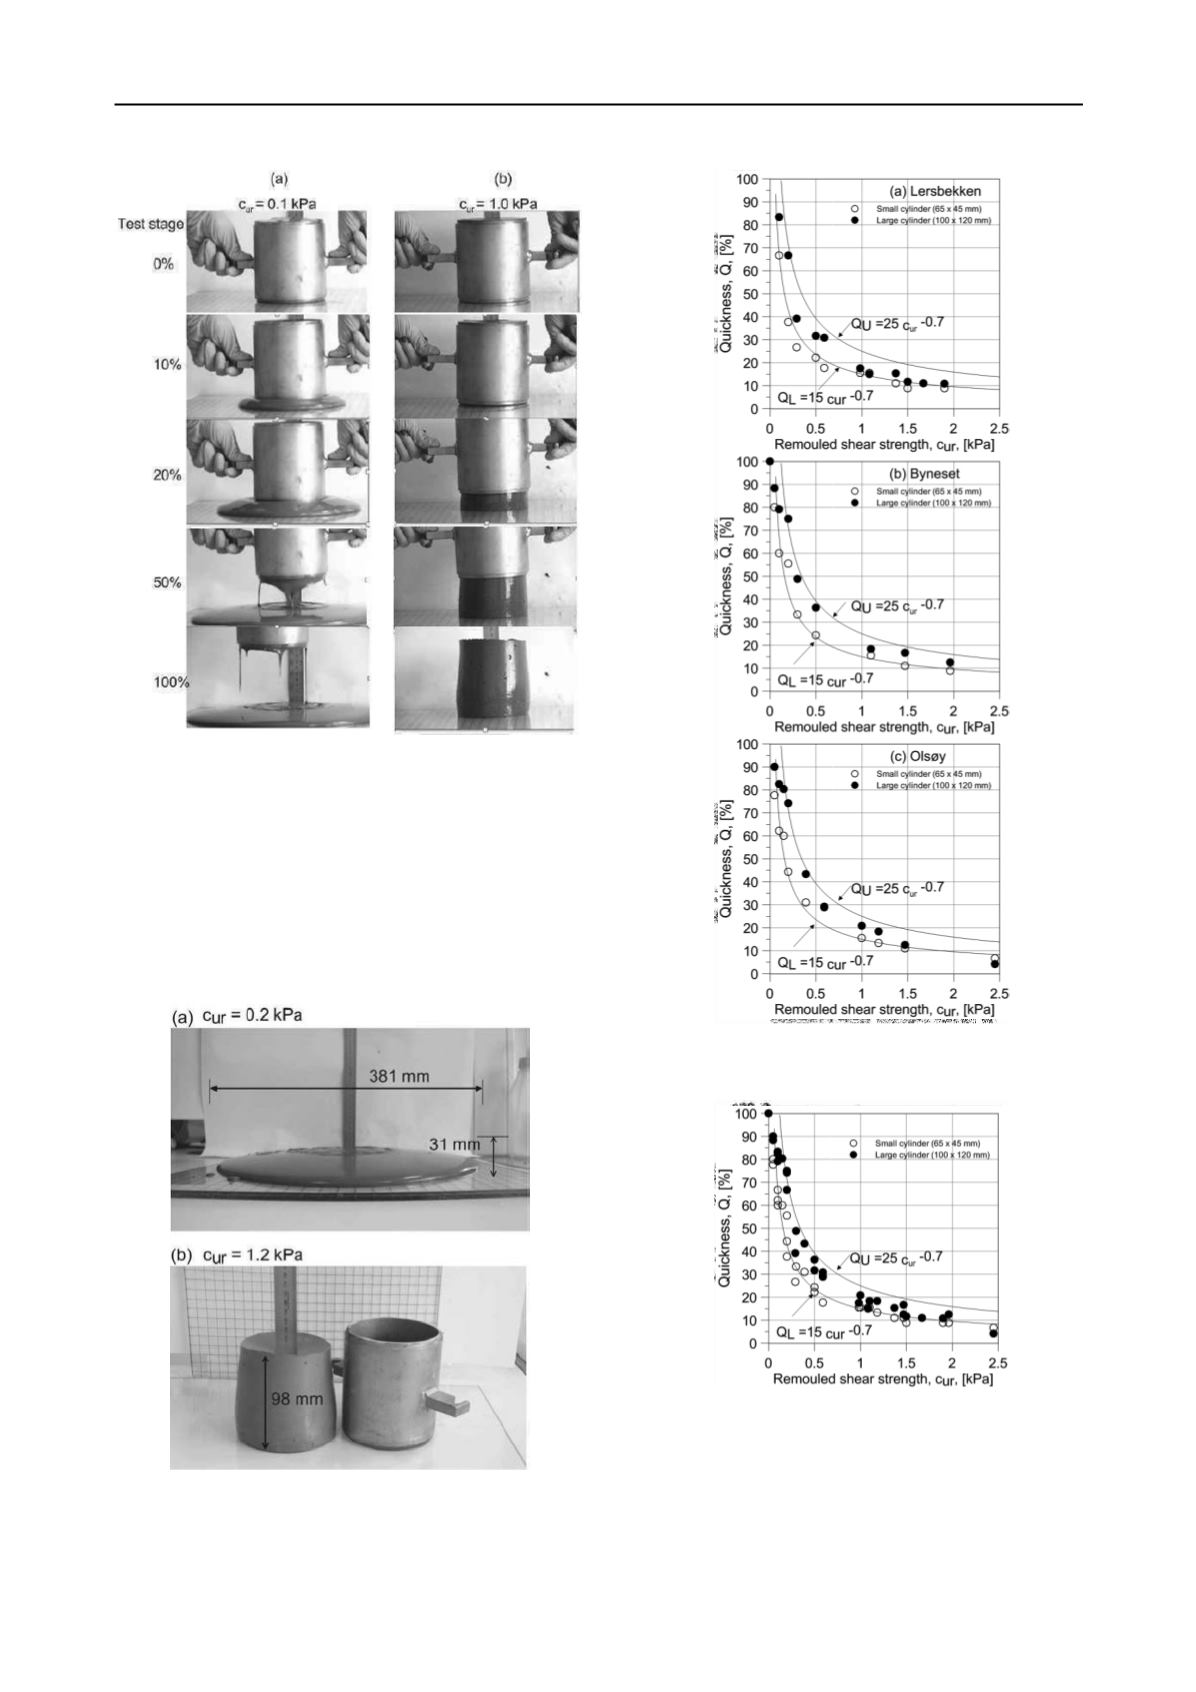
Figure 2. Slump and spread observed from the start to the end of
the Quickness tests for remoulded Byneset clays
(a)
c
ur
= 0.1
kPa and (b)
c
ur
= 1.0 kPa.
A typical flow and spread behaviour of two remoulded clays
from the Olsøy site are presented in Figure 3. The tests on
Olsøy clay shows that the remolded material with
c
ur
< 0.2 kPa
seemed to be more like a soup, Figure 3(a). As the
c
ur
increases
from 0.2 kPa towards 1 kPa, the remolded material increasingly
showed less viscous behavior and for a
c
ur
> 1.0 kPa little or no
flow is observed, Figure 3(b). This simple test indicates why
soft sensitive clays with a
c
ur
> 1 kPa are less likely subjected to
a large retrogression or run-out.
Figure 3. Flow and spread behaviour of the two remoulded
Olsøy clays having (a) c
ur
= 0.2 kPa and (b) c
ur
= 1.2 kPa.
Figure 4.
Q
versus
c
ur
values registered on soil samples taken
from a) Lersbekken b) Byneset and c) Olsøy landslide locations.
Figure 5. Compilation of
Q
versus
c
ur
values registered on soil
samples taken from the three landslide locations.
Apparently, the flow behaviour of the Lersbekken, Byneset and
Olsøy clay is identical. Figure 4 presents
Q
versus
c
ur
for
various sets of tests on the Lersbekken, Byneset and Olsøy clays
performed with two different cylinder sizes, 100 mm x 120 mm,
65 mm x 45 mm. For the major area of interest, i.e. clay
samples with
c
ur
> 1.0 kPa, material flow was not registered
irrespective of the size of the test cylinders. Accordingly, this
Figure 4.
Q
versus
c
ur
values registered on soil samples
taken from a) Lersbekken b) Byneset and c) Olsøy
landslide locations.
Figure 4.
Q
versus
c
ur
values registered on soil samples
taken from a) Lersbekken b) Byneset and c) Olsøy
landslide locations.


