2259
Technical Committee 208 /
Comité technique 208
index (TWI). Each factor is classified into several classes; the
positive and negative weights of each class for each factor are
calculated using an open-source software ILWIS (Integrated
Land and Water Information System). To each factor, a class
trigger for positive or negative weight is chosen at the class
whose contrast reaches the highest value (see highlight classes
in Table 2).
Figure 2. Landslide inventory map for modelling (103 points)
Table 2. Weight values of classes from parameters
Parameter Value
W
W
DEM
100m ~ 200m
0.620
-0.488
ASPECT
West
0.470
-0.121
SLOPE
0° ~ 10°
0.073
-0.078
GEO
Claystone, sandstone with diatomite 1.009
-1.960
DTR
< 100m
0.758
-0.274
DTD
300m ~ 400m
0.881
-0.180
TWI
4 ~ 6
0.137
-0.077
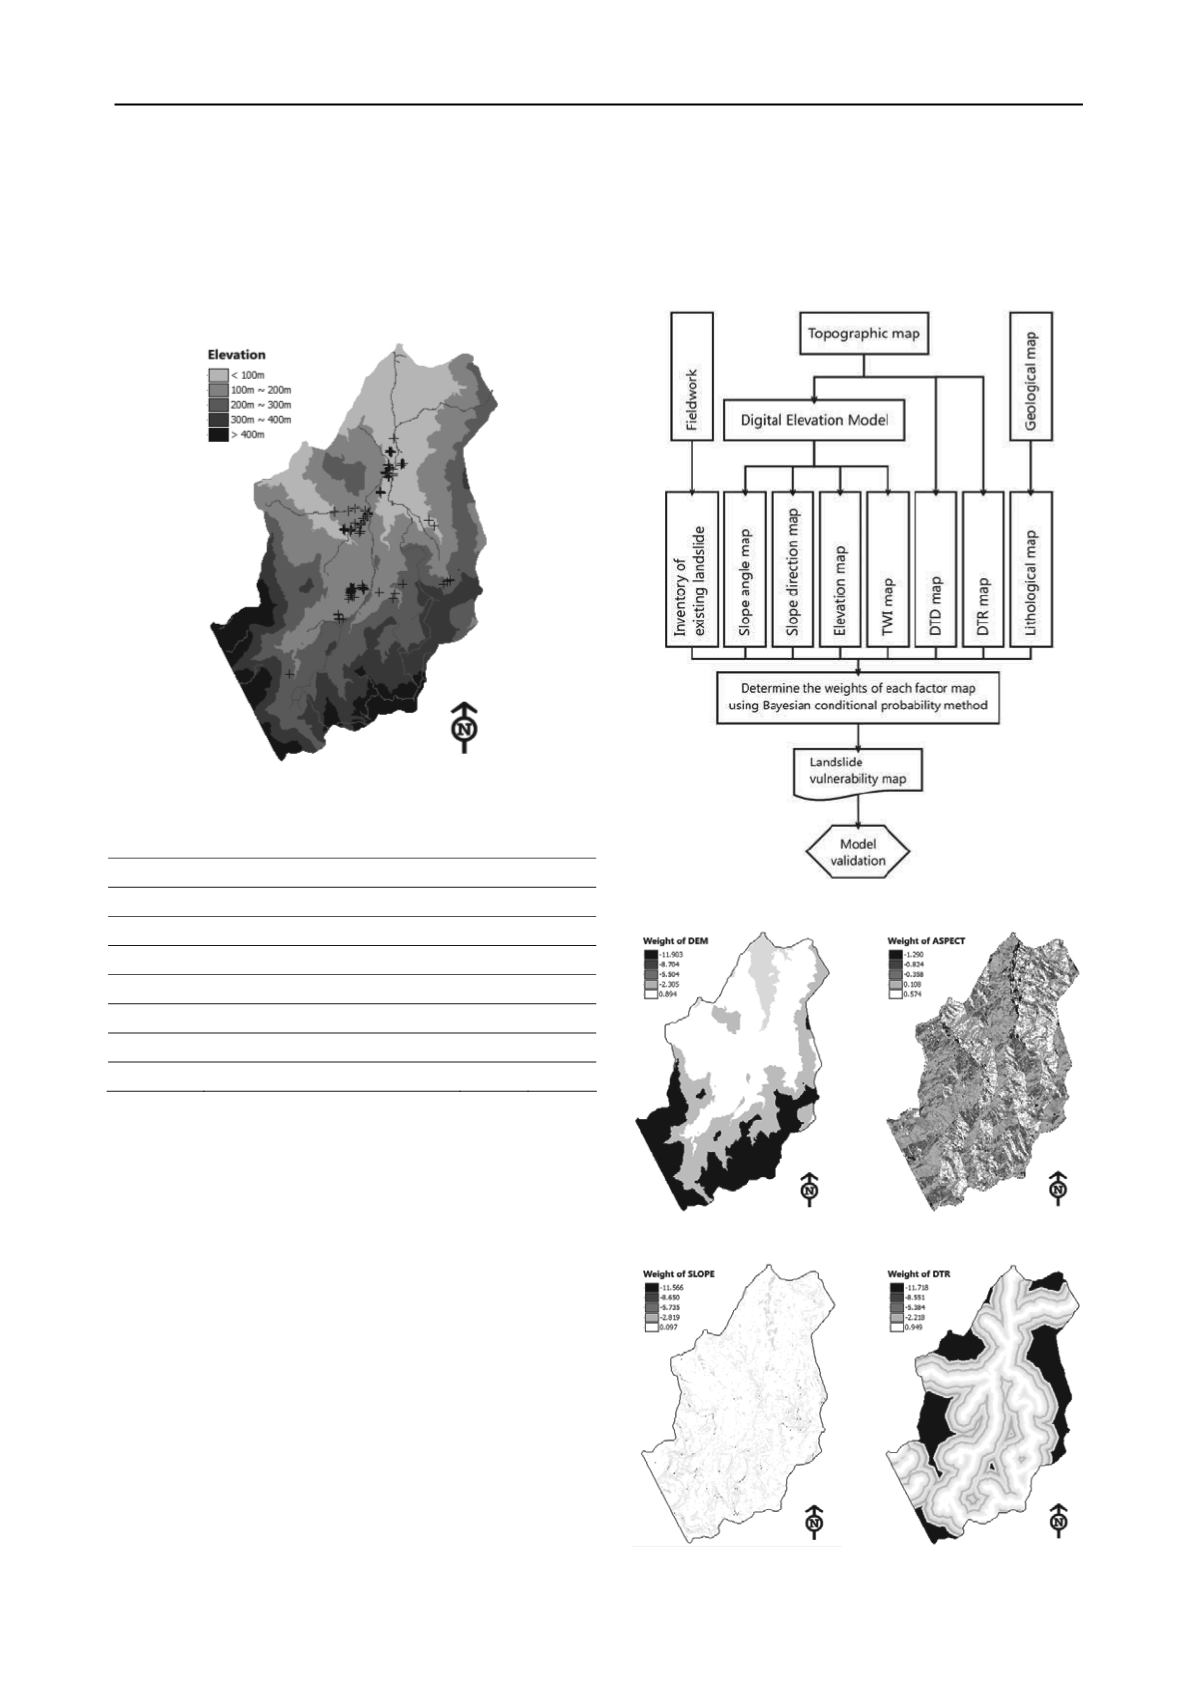
The flow chart of the procedure for landslide susceptibility
mapping by Bayesian conditional probability is shown in Fig. 3.
Weights of seven factor maps are calculated and expressed
as weight maps and displayed in Fig. 4 to Fig. 10.
The Bayesian conditional probability map is derived from
seven factor maps using the formula (3). However the slicing of
this probability map into landslide susceptibility zones is not
applicable because the ranges of landslide probability on
different probability maps from different methods are totally
different. Therefore the probability pattern is sliced into
susceptibility zones using the ranking of predicted probability
value instead of predicted value itself (Chung and Fabbri,
2003). A pixel of highest probability will be assigned the
highest rank and pixel of lowest probability will be the lowest
rank. After ranking all pixels within the study area, the landslide
zoning could be carried out using predefined threshold values of
different zones: high, moderate and low susceptibility.
In the study area, those threshold values are 15%, 25% and
60% for the high, moderate and low susceptibility area
respectively. The landslide susceptibility map is presented in
Fig. 11.
2.3
Validation
The landslide susceptibility map is validated by using 39 heavy
landslide occurences (white plus symbols on Fig. 12). Among
them there are 31 points classified as high landslide
susceptibility (80% accuracy).
Figure 3. Procedure of landslide susceptibility mapping
Figure 4. Weight of elevation
factor
Figure 5. Weight of aspect factor
Figure 6. Weight of slope angle
factor
Figure 7. Weight of DTR factor


