2263
Technical Committee 208 /
Comité technique 208
and Wartman 2011). This relationship is characterized by a
threshold behavior whereby nominal changes in acceleration
ratio are greatly amplified into large changes in predicted
displacement and hence uncertainty (Figure 3).
In order to capture this, multiple simulations were
performed with the purpose of generating three different
distributions of
k
y
targeted to have low, moderate and high
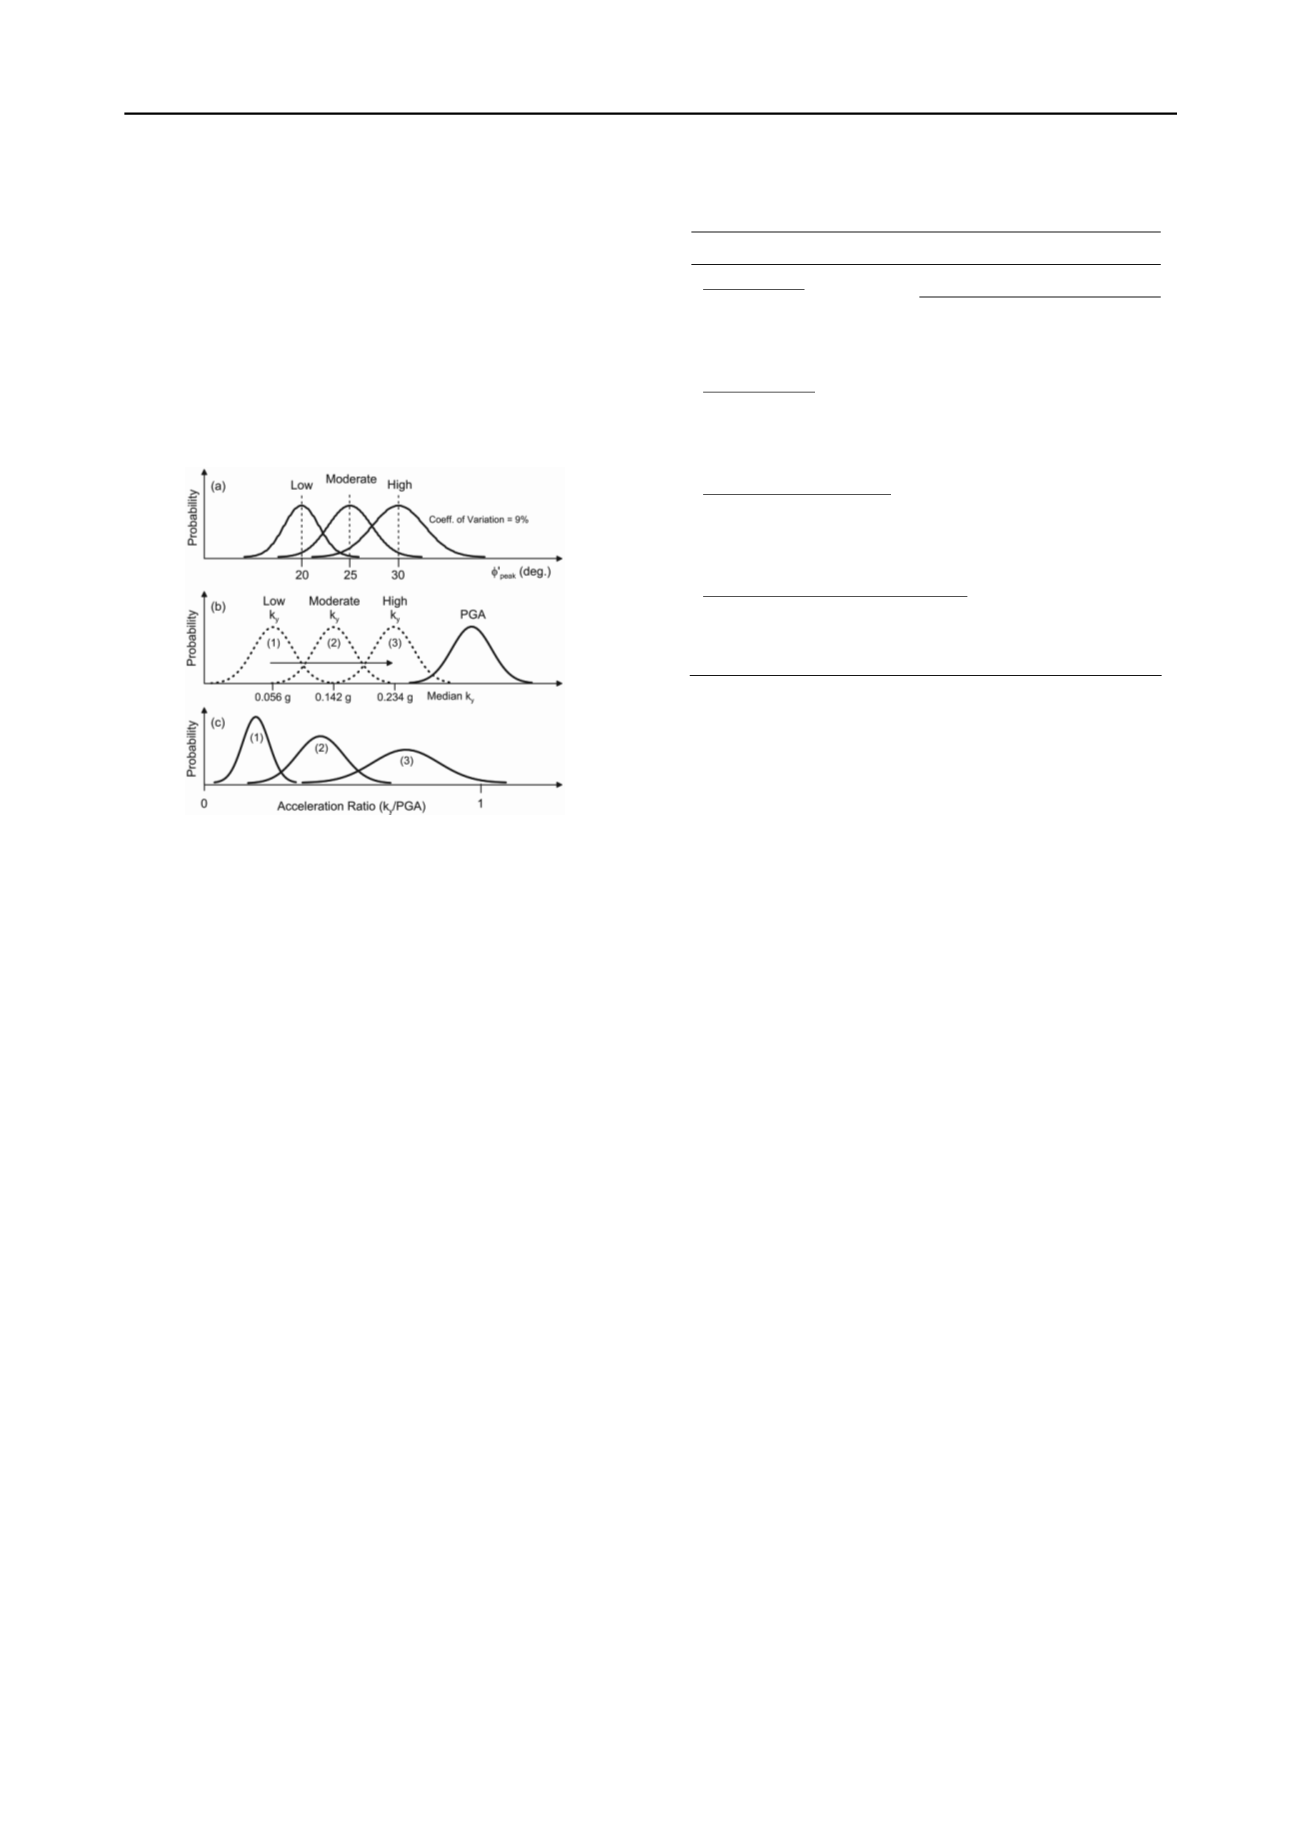
median values. To do this, probability distributions of
'
peak
were systematically varied through the pseudostatic analysis to
control the slope’s seismic resistance; these distributions are
referred to as “low”, “moderate” and “high” strength and are
illustrated in Figure 4a.
Figure 4. Illustration of the relationship between the
k
y
and
PGA
distributions and the resulting
k
y
/PGA
distributions. Corresponding
distributions of
'
peak
are shown for the three strength conditions.
By holding the distribution of
PGA
constant and varying the
k
y
distributions (Figure 4b), sampling of acceleration ratios was
targeted to concentrate along different portions of the
k
y
/PGA
scale (Figure 4c). For each ground motion variability scenario,
three separate simulations for each strength condition were
performed. This approach allowed displacement uncertainty to
be quantified along different regions of displacement-
acceleration ratio relationship and provided insight into how
both method non-linearity and ground motion variability affect
the level of prediction uncertainty.
5 DISPLACEMENT ANALYSIS RESULTS
Statistical measures of central tendency and spread were
calculated for the displacement data obtained from the Monte-
Carlo simulations of the different scenarios of ground motion
variability. Overall, the displacement data was observed to be
positively skewed as a result of several sources including
inherent distributional assumptions (e.g. log-normal GMPE),
truncation at prescribed limits (e.g.
k
y
below zero cannot exist,
no
k
y
/PGA
greater than 1) and method non-linearities (Figure 3).
Non-parametric statistics based on percentiles that are less
sensitive to data asymmetry and were used to describe the data.
For this study, uncertainty in the displacement predictions
was assessed using the interquartile range (
IQR
). This
parameter represents the range of the middle 50% of the
displacement data and is calculated as:
IQR
=
P
75
–
P
25
where,
P
75
and
P
25
are the 75
th
and 25
th
percentiles of the data.
Interquartile range data is summarized in Table 1 for the
different ground motion variability scenarios and strength
conditions.
Table 1. Summary of displacement interquartile range for the different
ypes of ground motion variability and strength conditions
t
Ground Motion Variability
Displacement IQR (cm)
No Variability
LHA ORR VAS WPI
Low Strength
8.2
7.5
9.1
9.4
Moderate Strength
0.4
0.5
0.9
0.8
High Strength
0.1
0.1
0.2
0.2
Varied intensity
Low Strength
14.6
12.9
15.9
16.4
Moderate Strength
2.3
2.0
3.4
3.0
High Strength
0.7
0.7
1.3
1.0
Varied intensity-frequency
Low Strength
15.3
13.9
17.1
17.5
Moderate Strength
2.6
2.3
3.9
3.5
High Strength
0.8
0.9
1.5
1.3
Varied intensity-frequency-waveform (all 4 motions)
Low Strength
16.7
Moderate Strength
3.0
High Strength
1.0
6 DISCUSSION
The seismic displacement results presented in Table 1
demonstrate that the combined variability from both ground
motions and the soil properties have a marked influence on
displacement prediction uncertainty. For the scenarios
evaluated, uncertainty is also observed to increase as variability
in the intensity, frequency content and waveform are
incrementally introduced into the probabilistic seismic
displacement analysis.
6.1
No Variability
For this scenario, displacement uncertainty is due
entirely
to the
variability in the seismic resistance, specifically the
k
y
distributions. With no variability in the ground motions, the
displacement-acceleration ratio relationship (
-
k
y
/PGA
) plots as
a smooth, monotonically-increasing line; the
-
k
y
/PGA
relationship for the LHA parent motion is shown in Figure 5.
At low acceleration ratios, this relationship is highly non-linear
which causes parametric variability of
k
y
to be magnified into
large displacement uncertainty (
IQR
of 8 to 9 cm at the low
strength) that progressively reduces as the relative stability of
the slope increases (moderate to high strength conditions). This
is consistent with the median
k
y
/PGA
that increases from about
0.20, 0.51 and 0.83 for the low, moderate and high strength
k
y
distributions. For this scenario, the
-
k
y
/PGA
relationship for
the LHA motion is similar to that for the other parent motions
which is due to the fact that all four motions were spectrally
matched to the same median response spectrum and thus predict
a similar response.
6.2
Varied Intensity
For this scenario, variability in
k
y
and intensity of the ground
motions contribute to the overall displacement uncertainty. As
these are scaled motions, the frequency content is constant in
the displacement analysis of each parent motion. The
-
k
y
/PGA
relationship for the LHA motion is compared to the case of no
ground motion variability in Figure 5. Significant scatter is
observed in the
-
k
y
/PGA
relationship and the displacement
uncertainty for each parent motion is higher than that for the
case of no ground motion variability. By including variability
in the shaking intensity, the displacement
IQR
is observed to
increase by a factor of nearly 2 for the low strength condition.
The
IQR
increases by factors of 4 and 5 for the moderate to high
strength conditions.


