2268
Proceedings of the 18
th
International Conference on Soil Mechanics and Geotechnical Engineering, Paris 2013
study recommends using a cylinder size 100 mm x 120 mm and
proposes some correlations based on this cylinder size because
this cylinder size is readily available in connection with the
standard proctor test. The Figures presents the lower and the
upper bound
Q
values observed for various
c
ur
of the tested
material. A combined plot is shown in Figure 5 where all the
data from the three landslide locations are plotted together.
Thakur and Degago (2012) suggests considering the lower
bound quickness in evaluating flow slide potentials since it
provides a conservative estimate. It can be noticed from the
quickness test results (Figure 4 and 5) that all Lersbekken,
Byneset and Olsøy materials have nearly identical responses
and the lower bound
Q
= 15 % corresponds to
c
ur
= 1 kPa for all
the three sensitive clays.
4 SUITABILITY OF QUICKNESS TEST
Suitability of quickness value (
Q
) as compared to remoulded
shear strength (
c
ur
) in relation to assessment of flow behaviour
of materials is briefly discussed.
Fluidity of sensitive clays is difficult to interpret by small
numerical values of
c
ur
because a seemingly small change could
imply significant alteration in flow behaviour of clay. For
example, a significant change in the flow behaviour of the
sensitive clay from the Lersbekken site is observed for a small
variation of
c
ur
, i.e. from 0.5 to 0.2 kPa. In this case, the
significant behavioural change is reflected by the quickness test
visually as well as numerically
Q
varies from 32% to 67%
(Thakur and Degago, 2012). The quickness test amplifies the
small range of
c
ur
, i.e. from 0 to 2.0 kPa, to a larger scale, 0 to
100%. Quickness test therefore gives a better visualisation of
the flow behaviour of sensitive clays where small
c
ur
values
have large implications in regards to understanding the potential
for retrogressive landslides.
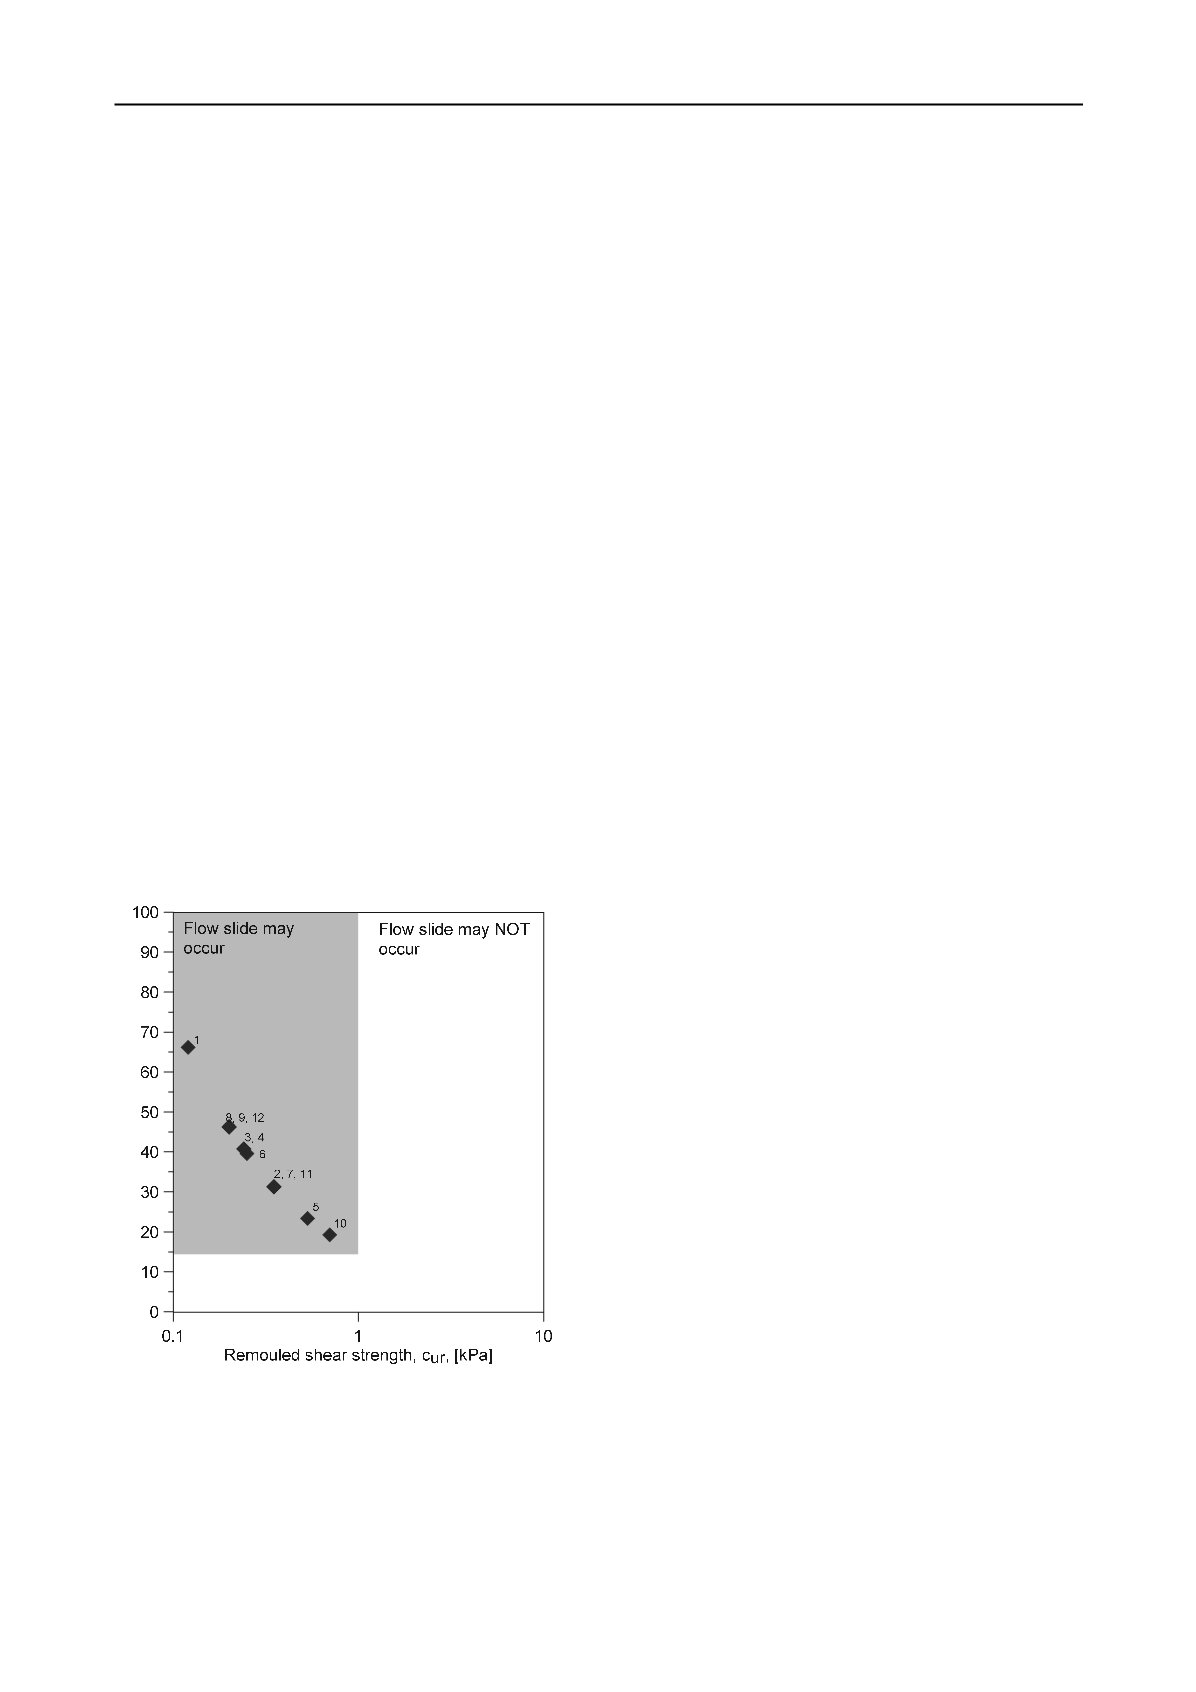
Quickness, Q, [%]
Figure 6. Estimated
Q
values for Norwegian landslides given in Table 1
and quickness based criteria for occurrence of flow slides.
In general, both
c
ur
and
Q
principally explains the same soil
characteristic through different test approaches. The fall-cone
test is a point specific method calibrated against the undrained
shear strength of soil under undisturbed and remoulded state;
whereas, the quickness test gives a value that is representative
of the volume of the material tested. In contrast to the fall-cone
test, the quickness test has an added advantage of qualitative
description that can provide a better visualization with respect
to understanding flow slide (Thakur and Degago, 2012).
5 ASSESMENT OF FLOW SLIDE POTENTIALS
Significance of quickness test is illustrated in relation to
assessment of potential for flow slides using the Norwegian
landslides given in Table 1. In doing so the
Q
values for each
landslides is estimated based on the corresponding
c
ur
values
and using a lower bound correlation shown in Figure 5 (
Q
= 15
c
ur
-0.7
). The estimated Q values of the Norwegian landslides are
shown in Figure 6 where the numbers corresponds to the
landslide numbers as listed in Table 1.
Based on the quickness test results and the data from the
Norwegian landslides, two distinct regions are shown in the
Figure 6. These regions depict the potential for occurrence of
flow slides based on
Q
values. Accordingly, large flow slides
are less likely to occur when
Q
< 15 % (or
c
ur
> 1 kPa) and in
this case the slide will be limited to an initial slide only.
However, for
Q
> 15 % (or
c
ur
< 1 kPa), a flow slide is possible.
Based on the retrogression length (
L
R
) of the Norwegian
landslides studied in this work, 15 % <
Q
< 25 % (or 0.5 kPa <
c
ur
< 1 kPa) mostly corresponds to a flow slide with
L
R
< 250 m
while
Q
> 25 % (or
c
ur
< 0.5 kPa) corresponds to a flow slide
with
L
R
> 250 m. Effort is being made to establish a correlation
between
L
R
and
Q
using several landslide data, however at this
stage no specific recommendation is made.
6 CONCLUSIONS
This paper presents a new laboratory procedure that focuses on
remoulded behaviour of sensitive clays in terms of a numerical
value referred to as quickness (
Q
). The quickness test was used
to demonstrate why sensitive clays with
c
ur
> 1.0 kPa are not
susceptible to flow. This particular study shows that a
Q
< 15%
or
c
ur
> 1.0 kPa seems to be the threshold limit where the extent
of the retrogression of a landslide is limited to the initial slide.
7 ACKNOWLEDGEMENT
National research program “Natural hazards: Infrastru
cture,
Floods and Slides (NIFS)”, by the Norwegian Public Roads
Authority, Norwegian Water Resources and Energy Directorate
and Norwegian National Railways Administration and Mrs.
Olga Lapkovski are acknowledged for their support.
8 REFERENCES
Lebuis J., Robert J.-
M. and Rissmann P. 1983. “Regional mapping of
landslide hazard in Quebec”, In Proceedings of the Symposiumn
Slopes on Soft Clays, SGI Report 17, 205
–
262.
Leroueil S., Tavenas F. and Le Bihan J.P. 1983. “Propriétés
caracteristiqués des argiles de I’est du Canada”, Canadian
Geotechnical Journal 20,681
–
705.
Locat J. and Demers D. 1988. “Viscosity, yield stress, remolded
strength, and liquidity index relationships for sensitive clays”,
Canadian Geotechnical Journal 25,799
–
806.
Mitchell R. J. and Markell
A. R. 1974. “Flow slides in sensitive soils.
Canad. Geotech. J. 11 (1), 11
–
31.
Tavenas F., Flon P., Lerouil S. and Lebuis J. 1983. “Remolding energy
and risk of slide retrogression in sensitive clays”, Proc. Symp.
Slopes on Soft Clays, Linkoping, Swedish Geotechnical Institute
(SGI) Report 17, 423
–
454.
Thakur V. and Degago S.A. 2012. “Quickness of sensitive clays”,
Géotechnique Letters 2 (3), 87-95.


