2062
Proceedings of the 18
th
International Conference on Soil Mechanics and Geotechnical Engineering, Paris 2013
Proceedings of the 18
th
International Conference on Soil Mechanics and Geotechnical Engineering, Paris 2013
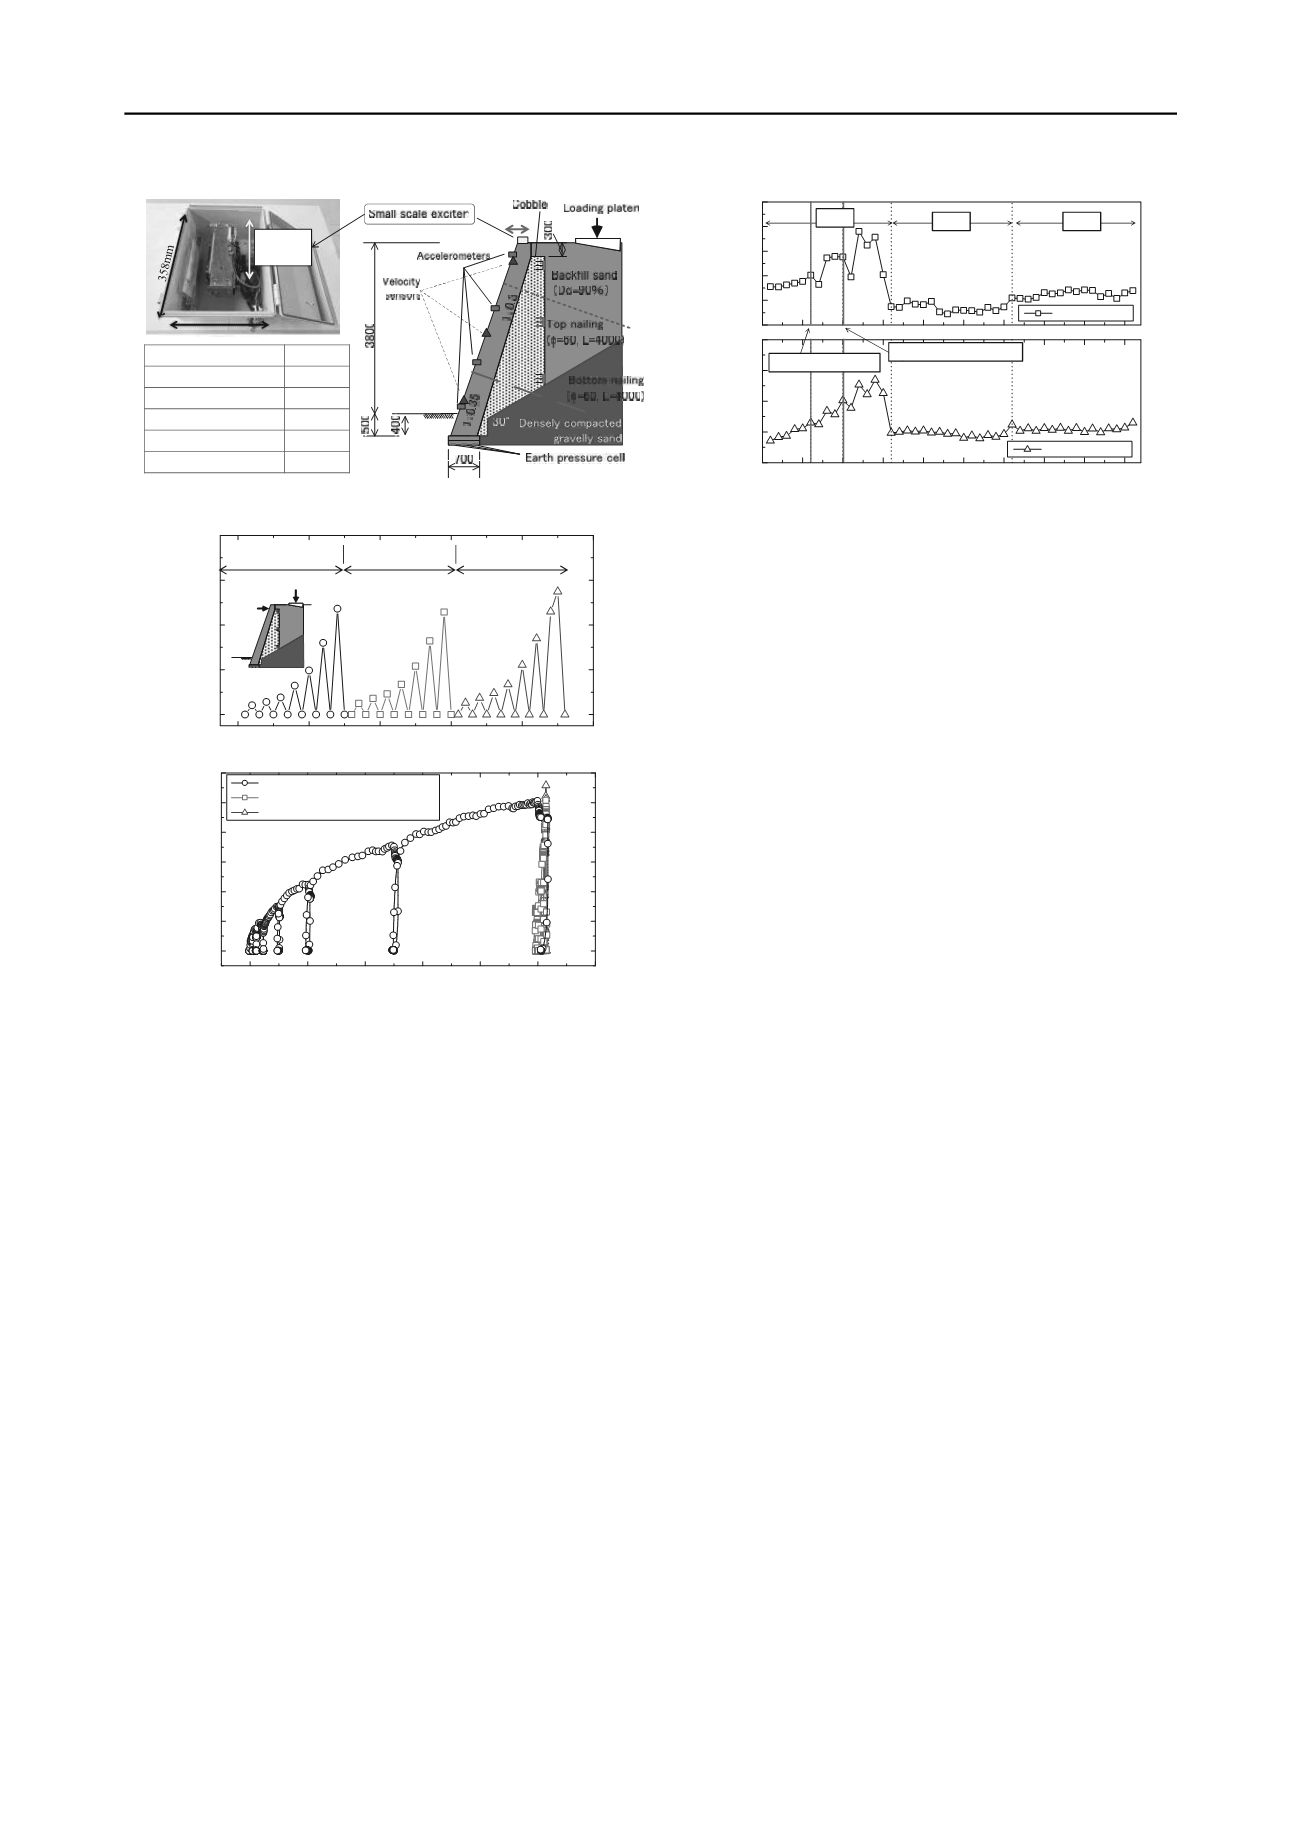
of loading process (Case 3). The loading and unloading
processes in each case were summarized in Figure 8.
At every loading and unloading process, sets of percussion
test with a set of velocity sencers and vibration tests using the
developed small scale exciter with a set of accelerometers were
conducted so as to investigate into the difference of vibration
characterestics obtained from each test. Vibration test was
conducted by applying the sinusoidal sweep excitation to the
retaining wall model by the small scale exciter fixed at the top
of the retaining wall, while the constant amplitude of 1000 gals
with frequency range of 3 to 100 Hz and sweeping rate of 3
Hz/sec were adopted as the test condition.
Figure 8 also shows load-displacement relationships obtaied
from the loadcell installed at the hydraulic jack and
displacement transducer at the top of the retaining wall. As
clearly shown in Figure 8, the increment of the wall top
displacement was drastically reduced by adding the soil nailing
although the same amplitude of loading processes were applied
to the wall. Displacement increment during a set of loading and
unloading processes in Cases 1, 2 and 3 were 50mm, 1.0mm
and 0.5 mm respectively.
Figure 9 shows relationships between the number of step
and the results from the percussion test and vibration test, while
the values of spectrum area of frequency range of 3 to 40 Hz
were plotted in the virtical axes. It should be empasized that the
spectrum area evaluated from the pecussion test results Sa[p]
has the dimension of velocity (cm/sec) because it was evaluated
from the integration of the relationships between the Fourier
’
s
amplitude of velocity (cm/sec*sec) computed from records of
the velocity sensor at the top of the wall and the freauency
(1/sec). On the other hand, the spectrum area calculated from
the vibration testing Sa[v] did not have any dimensions because
it was evaluated from the transfer function of the top
accelerometer against the input acceleration.
It was found from Figure 9 that the values of Sa[p] and Sa[v]
increased with the number of step. Moreover, the effect of the
nailing could be also detected as the reduction of the values of
Sa[p] and Sa[v] in Cases 2 and 3 as compared with Case 1. The
diffrence between Sa[p] and Sa[v] could be found especially in
loading and unloading process. The values of Sa[v] increased in
the loading process and reduced in the unloading process, which
indicated that the spectram area Sa[v] based condition rating
using the vibration testing with the small scale exciter could
detect a minor change of the stability of the retaining wall. The
value of Sa[p], however, could not detect a minor change during
single loading and unloading process, which was possibly
because the input force could not be kept constant. It was found
from the results of the site tests and prototype scale loading test
that the percussion test and the vibration testing could be
applicable, while vibration testing could detect a minor change
of the stability of the retaining wall.
5 SUMMARY
It was attempted in this study to develop a inspection method of
the existing retaining wall. It was found from the preliminary
survey on the current state of Japanese railway retaining wall
that condition rating of the leaning and the ashlars wall are
important because of their huge amount of existing structures.
Based on the site test and prototype scale loading test, it was
found that the percussion test and vibration test using the
spectrum as an index could be applicable for the condition
rating of existing retaining walls.
6 REFERENCES
Oyado, M., Miyashita, M., Ueda, S. and Sakairi, A., An at-tempt of
rationalizatiojn for maintenance of railway structure using
supporting system,
Proc. of 5th International conference for bridge
maintenance, Safety and Management
, pp.3459-3466, 2010.
Railway Technical Research Institute, Maintenance Standards for
Railway structures, 2007.
Nishimura A., Okumura, F. and Tanamura S., Integrity Judg-ment of
Railway Bridges by Percussion Tests for Structure Response,
Quarterly Report of RTRI
, Vol. 29, No.4, pp.184-189., 1988.
S. Nakajima, M. Shinoda, K. Abe, T. Mai and T. Ehara: Study on
inspection method for railway existing retaining walls using
vibration testing,
IS-Hokkaido 2012: 2nd international conference
on transportation geotechnics
, 2012.
Shinoda, M., Nakajima, S., Abe, K., Tetsuo M. and Ehara, T.:
Development of nondestructive inspection method of railway
bridge substuructures with small vibration exciter,
Proc of the
International workshop on ICT in Geo-Engineering (ICTGE2012)
,
17-18 May 2012.
0.10
0.20
0.30
0.40
0.50
0.60
0 5 10 15 20 25 30 35 40 45
0.05
0.10
0.15
0.20
0.25
Percussion test
Spectrum area, Sa[p] (cm/s)
Vibration testing
Number of step
Spectrum area, Sa[v]
Case2
Case3
Case1
Lift up at heel of base
Local failure at toe of base
Figure 9. Cross section of model (unit in mm)
336mm
Moving
direction
Rated sine force (N)
98
Max. displacement (mm)
80
Max. velocity (cm/s)
74.8
Max. acceleration (m/s
2
)
14
Frequency range (Hz)
3-200
Shipping weight (N)
147
Figure 7. Cross section of model and outline of developed exciter
(unit in mm)
0
10
20
30
40
50
0
200
400
600
800
Load(kN)
Number of steps
Load
Horizontal
disp.
Case 1 (Without
nailing)
Case 2 (With top
nailing)
Case 3 (With top and
bottom nailing)
0
10
20
30
40
50
60
0
100
200
300
400
500
600
Load(kN)
Horizontal displacement at wall top (mm)
Case1 (Without reinforcement)
Case2 (With top nailing)
Case3 (With top and bottom nailing)
Figure 8. Loading process and load-displacement relationships


