2056
Proceedings of the 18
th
International Conference on Soil Mechanics and Geotechnical Engineering, Paris 2013
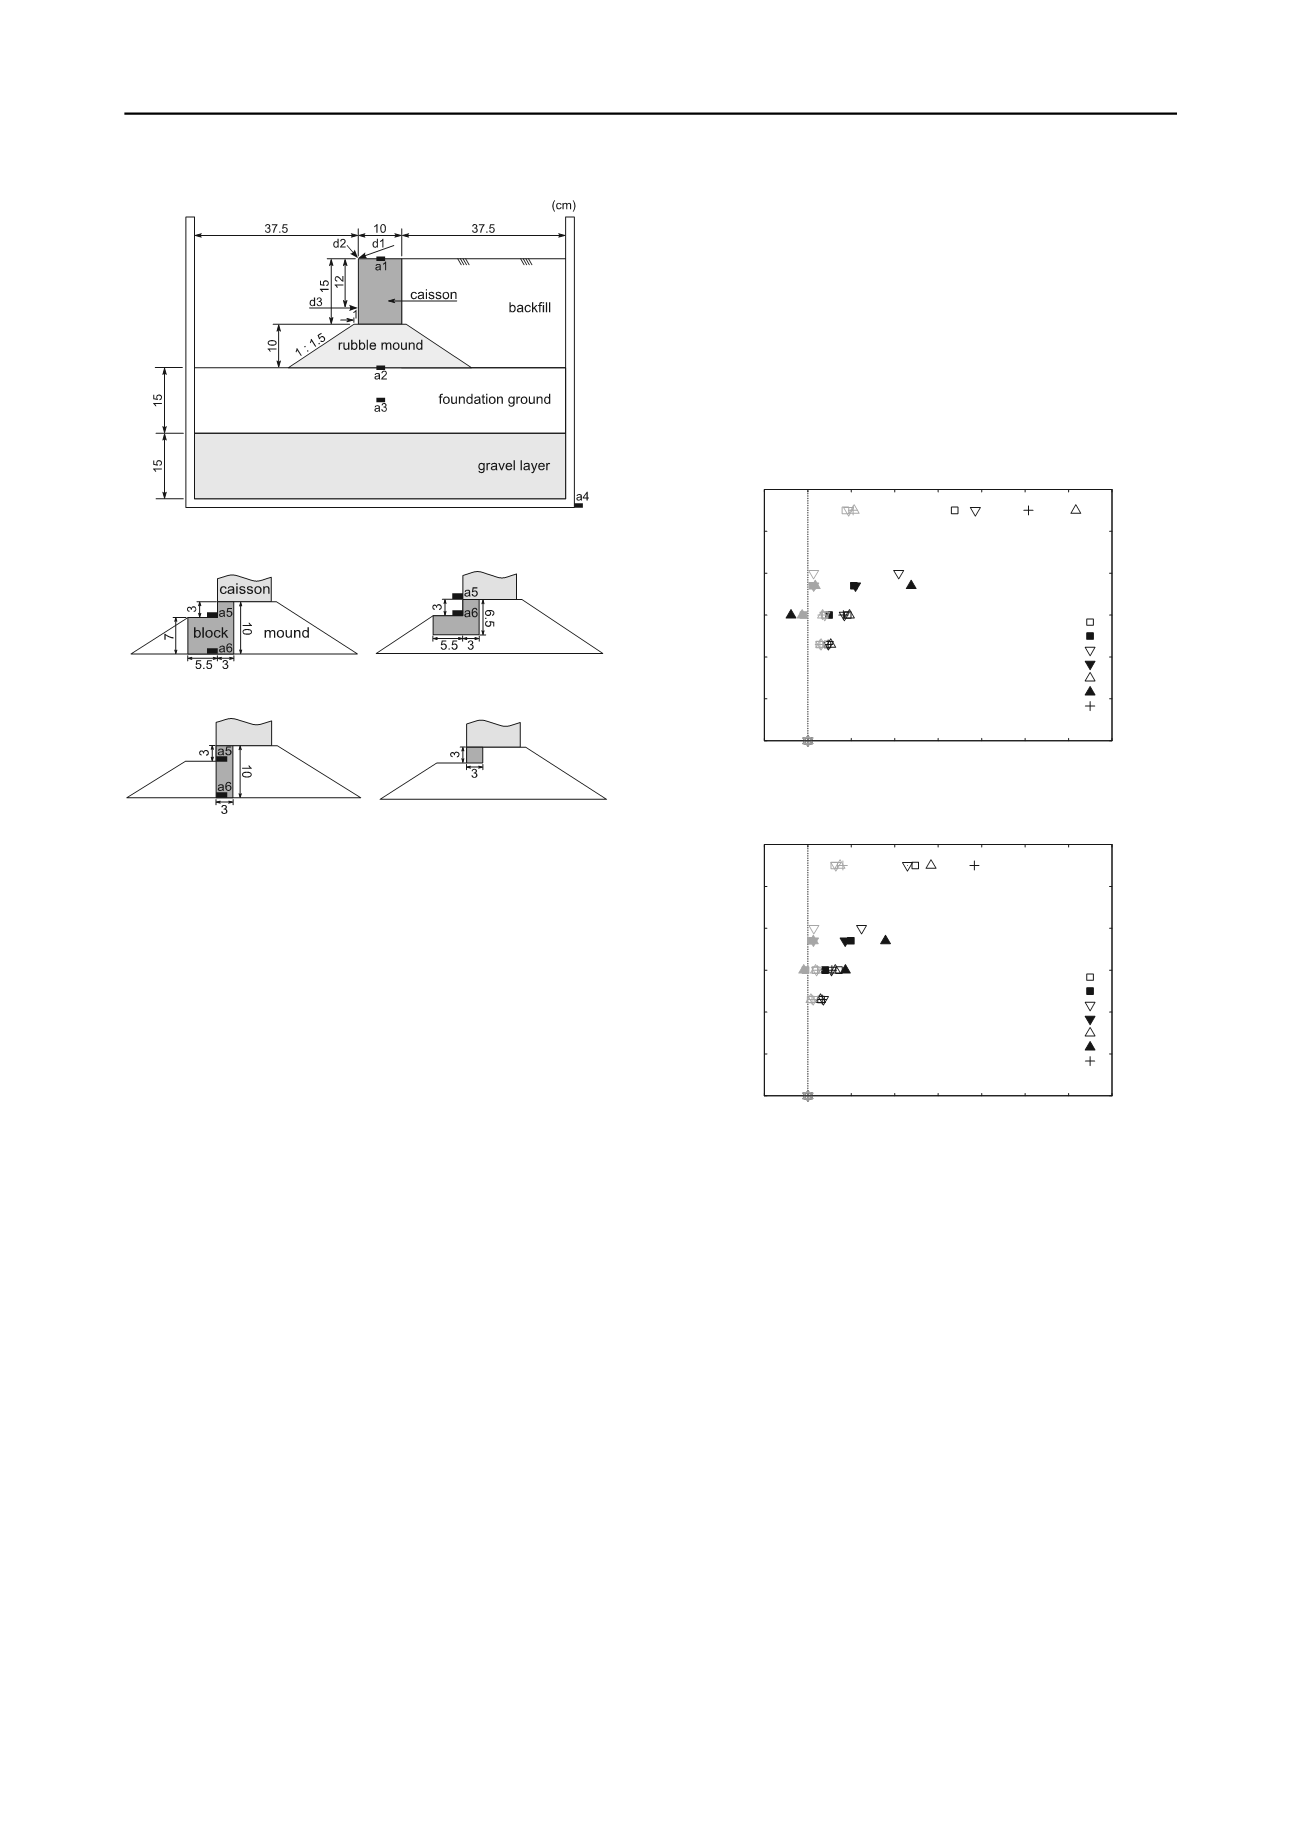
Figure 4. Schematic view of the model ground.
Type 1
Type2
Type 3
Type 4
Figure 5. The blocks used in the tests to simulate solidified area in the
rubble mound.
First, foundation ground was made by the air pluviation
method with Souma sand #6 (
s
= 2.649g/cm
3
,
dmax
=
1.544g/cm
3
,
dmin
= 1.169g/cm
3
,
D
60
= 0.161mm). Relative
density of the foundation ground was about 60%. A rubble
mound was built on the foundation ground by gravel #7 (single-
sized crushed stone S-5, JIS A 5001) whose particle size was
from 2.5 to 5mm. The gravel was placed into a mound by hand,
and was not compacted. Density of the rubble mound was about
1.5g/cm
3
. The solidified area in the mound was modeled as a
block made of cement paste, and put in the rubble mound. The
surface of the rubble mound was covered by gauze to prevent
sand particles from dropping into voids within the rubble
mound. Then a caisson was located on the mound. The caisson
was a wood box in which sand was filled to adjust its weight.
Density of the caisson was 0.98g/cm
3
. Finally, backfill was
prepared in the same way as the foundation ground.
In the series of tests, blocks having the four shapes, shown in
Figure 5, were used. Moreover, the model of the quay wall
before improvement, a model without any blocks as shown in
Figure 4, was tested.
Accelerometers were placed at points a1-a6 shown in
Figures 4 and 5. Acceleration of the shaking table was measured
at a4 in Figure 4. Displacement of the caisson was measured at
d1-d3. The caisson was divided into three parts in the direction
of the face line of the quay wall. The face line is perpendicular
to the plane of this page in Figure 4. The measurement was
conducted at the center of the caisson to eliminate the effect of
friction between the caisson and side walls of the sand box. The
blocks, which were the models of solidified area, were divided
into three parts in the same manner.
The input wave was a sine wave with a frequency of 10Hz
and a wavenumber of 50. Direction of the shaking was
perpendicular to the face line of the quay wall. The model was
tested by the input wave with 100Gal maximum acceleration,
and the residual deformation of the model was recorded by
digital camera. Next, the amplitude of the input wave was
increased to 200Gal maximum acceleration, and the model was
tested again. In this manner, the model was tested with the input
waves whose maximum acceleration was 100, 200, 300, 500,
and 800Gal. Several tests were aborted at 500Gal, because
deformation of the models was too large to continue the test
procedure.
The objective of the tests was to evaluate the variation of
vibrational properties and deformation mode caused by the
different shapes of the solidified area. The similarity rule for the
model was not considered. The tendency of the vibration and
deformation of the models was compared relatively, and
derivation of the factor which affected the behavior of the quay
wall from the comparison was attempted.
0
10
20
30
40
50
60
0.8 1.0 1.2 1.4 1.6 1.8 2.0 2.2 2.4
elevation (cm)
amplification
gray: 100Gal black: 300Gal
Type1 (a1-a4)
(a5,a6)
Type2 (a1-a5)
(a6)
Type3 (a1-a4)
(a5,a6)
without block (a1-a4)
Figure 6. Amplification of acceleration seaward.
0
10
20
30
40
50
60
0.8 1.0 1.2 1.4 1.6 1.8 2.0 2.2 2.4
elevation (cm)
amplification
gray: 100Gal black: 300Gal
Type1 (a1-a4)
(a5,a6)
Type2 (a1-a5)
(a6)
Type3 (a1-a4)
(a5,a6)
without block (a1-a4)
Figure 7. Amplification of acceleration landward.
3. VIBRATIONAL PROPERTY OF QUAY WALL
The vibrational property of the quay wall would be different
before and after the improvement. Figures 6 and 7 compare the
maximum acceleration amplitude between the models with
differently shaped blocks. Figures 6 and 7 also show the
amplitude observed in the test of the model without any blocks.
Gray marks in the figures show the results observed with the
input waves whose maximum acceleration was 100Gal, while
black marks show the results with 300Gal. The maximum
acceleration amplitudes in figures were calculated as follows:
find the maximum acceleration in each cycle of sine waves,
calculate the average of the maximum acceleration for the
whole of input waves (50 cycles), and divide the average value
by the average of the maximum acceleration of a4 (the
acceleration of the shaking table, elevation = 0cm). The
acceleration time histories were stable for all tests with 100 and
300Gal acceleration, and the maximum acceleration for each
cycle remained largely unaltered during the shaking. The
calculation was made for each direction; Figure 6 shows the
amplitude of acceleration seaward (from the right-hand side to
the left in Figure 4) and Figure 7 shows that landward (from left
to right in Figure 4). In the case of the tests in which the
maximum acceleration of the input wave was larger than
500Gal, large deformation was induced and the accelerometers


