2060
Proceedings of the 18
th
International Conference on Soil Mechanics and Geotechnical Engineering, Paris 2013
Proceedings of the 18
th
International Conference on Soil Mechanics and Geotechnical Engineering, Paris 2013
Inspection” is performed to the specific structures in which
severe deterioration are detected at the time of the General
Inspection by means of detailed visual survey or using
measuring equipments. As discussed in BACKGROUND, this
study aims to develop a methodology which can be used for the
condition rating of the retaining walls quantitatively as an
alternative method of detailed visual survey.
2.2
Survey on current state of Japanese railway retaining
walls
A preliminary survey on current state of Japanese railway
retaining structures was conducted. In the preliminary survey,
information of typical types of retaining walls in Japan was
extracted from the database of the
“
Structural Management
Supporting system (SMS)
”
(Oyado et al. 2010). In total, the
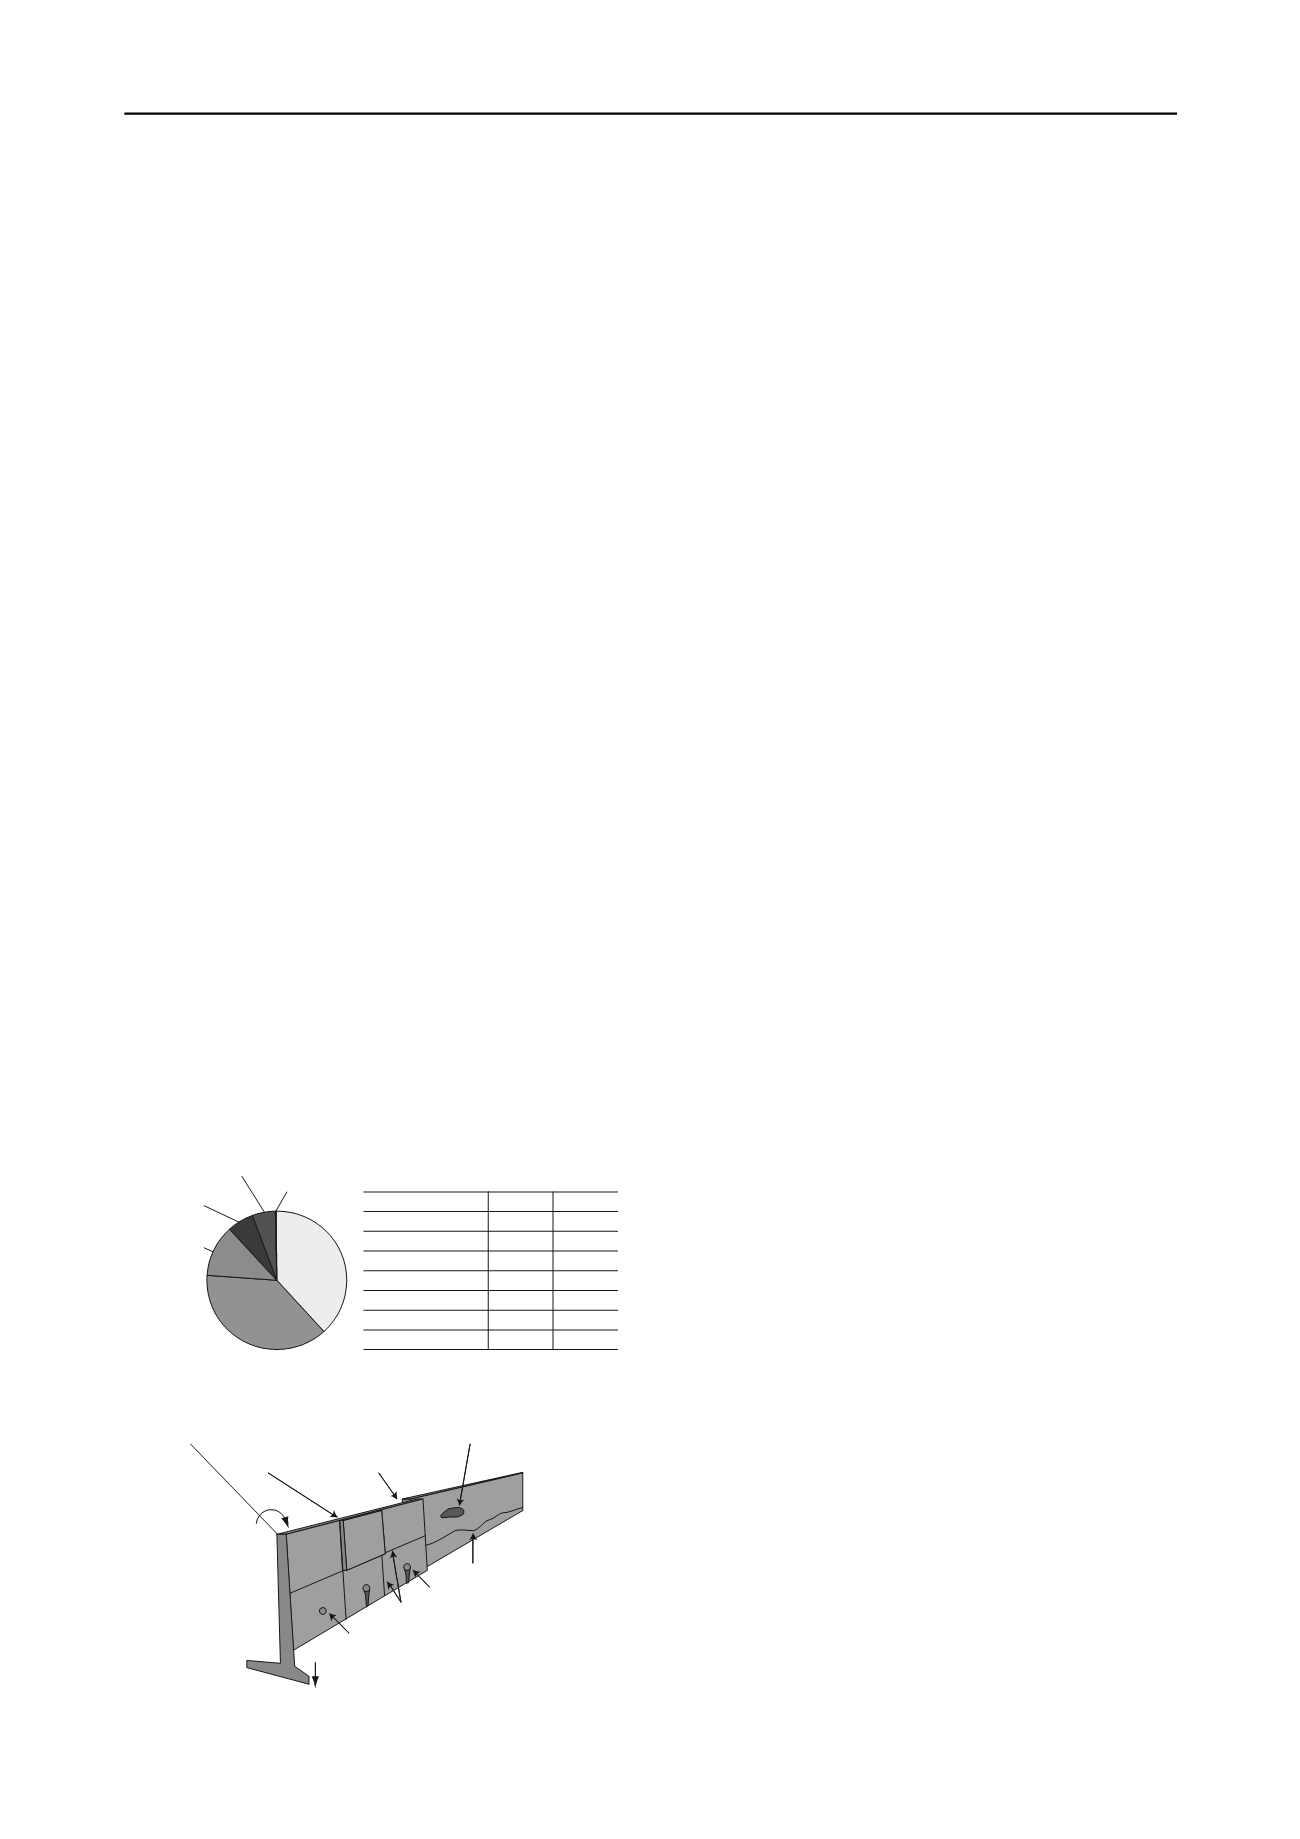
data of 7,989 sites could be extracted. Figure 2 shows the
relationships between the type of retaining wall and
construction length, which could be obtained using the efficient
1,657 sites data. Construction length of the leaning type
retaining wall stands first among all the types of the retaining
walls and it accounted for 38.3 % of the efficient data. The
percentage of the masonry and ashlar block retaining wall
reaches to 37.8 % as well. It was found from the above survey
that the leaning type and masonry or ashlar block retaining wall
occupies 76.1 % of the total construction length and it indicated
the importance of the management of these structures.
2.3
Deformation of retaining walls
Deformation of the railway retaining structures can be divided
into two groups; one is the deformation due to destabilization,
the other one is the deformation due to deterioration. Typical
deformation of the railway retaining structures is schematically
illustrated in Figure 3.
Settlement, inclination, swelling, difference in level and
difference at construction joint due to external thrusts can be
categorized to the deformation due to the destabilization.
Exfoliation of concrete, clogging of the drainage facilities is
categorized to the deformation due to the deterioration. Cyclic
load due to the train passing, increase of earth pressure due to
the additional construction of the embankment, increase of
dynamic earth pressure due to the earthquake, increase of water
pressure due to the change of the water level in backfill soil are
thought to be the source of the external thrusts, which could
cause the deformation due to the destabilization.
On the other hand, deterioration is thought to be caused by
the cyclic change of the thermal or humid condition during the
long period of its use. Deformation due to the destabilization
could be secondary source of the deformation like backfill
loosening, bearing capacity failure. Therefore, early detection
and retrofitting work against the deformation due to the
destabilization are highly important, while it has not yet been
developed a methodology to detect such phenomenon by the
nondestructive tests. Based on the discussion above,
development of a nondestructive evaluation method of the
existing retaining wall is attempted in this study.
3 APPLICATION OF PERCUSSION TEST FOR
CONDITION RATING OF RETAINING STRUCTURES
3.1
Percussion test
In Japanese railway field works, nondestructive evaluation of
the bridge substructure has been carried out by conducting a
percussion test (Nishimura et al. 1989) . In the percussion test,
the natural frequency of the bridge pier is measured with high
accuracy and it is used for the evaluation of the structural health
of the pier. This method was based on the knowledge that the
natural frequency of the bridge substructure decreased with the
damage of the structures and increased with the reinforcement.
Natural frequency of the bridge piers is evaluated by
carrying out a spectrum analysis using measured free vibration,
which is recorded by velocity sensors. Free vibration is induced
by hitting the top of the piers using an iron ball. In practice,
current performance of bridge pier can be evaluated by
comparing the measured natural frequency with the one of
immediately after the construction or the criterion of the
potential natural frequency. Potential natural frequency is the
experimentally-based proposed value by Railway Technical
Research Institute so as to be used for the site where the natural
frequency immediately after the construction was not recorded.
3.2
Site test results
A series of site test was carried out so as to examine the
applicability of percussion test for the condition rating of
retaining wall. In the series of site tests, leaning type and ashlars
wall are highlighed because construction length of these types
of retaining wall was much longer than the other types of walls.
As summraized in Table 2, 52 site tests were carried out by
selecting the deformed and sound retaining walls so as to
investigate into the difference of the vibration characterestics of
retaining wall. Percussion test was conducted by hitting the
iron ball at the top of the retainig wall and vibration was
measured by the velocity sencers attached at the top, middle and
bottom of the retaining wall.
Figure 4 shows an example of test result obtained from test
No. 3. Predominant frequency of 26.6 Hz could be evaluated
based on the changes of phase angle, while the peak amplitude
was not clearly observed. This behavior indicates that natural
frequency based condition rating, which has been adopted in the
condition rating of the bridge substructure, was difficult
possibly because the mode of vibration of retaining walls are
generally more complicated than the oridinally bridge
substructures. As an alternative index for the condition rating of
the retaining wall, the authors proposed the value of spectrum
area Sa, which could be evaluated by integrating the Fourier
’
s
spectrum of the amplitude as schmatically illustrated in Figure
4b), while frequency range of 3 to 40 Hz was selected in this
study. Figures 5 and 6 show the relationships between results
of condition rating based on visual inspection and the values of
Masonry
Ashlar block wall
37.8%
Leaning type
wall
38.3%
Gravity type wall
6.2%
Cantilever type
wall
12.1%
U-shaped wall
5.3%
Counterfort wall
0.2%
Masonry/Ashlar block
Leaning type
Gravity type wall
Cantilevet type wall
U-shaped wall
Counterfort wall
Type of wall
Number
409
802
249
85
7
105
Total
1,657
Length(km)
41.1
40.6
13.0
6.7
5.7
0.2
107.3
Figure 2. Relationships between construction length and types of
retaining wall
D ifference at
construction joint
C onstruction Joint
C racking
D rainage pipe
C logging ofdrainage facilities
Exfoliation ofconcrete
Settlem ent
Inclination
D islocation at
construction joint
Figure 3. Typical deformation of retaining wall


