2057
Technical Committee 207 /
Comité technique 207
tilted; the data were not processed because the accuracy of the
measurement of acceleration would be less.
For the test results with 100Gal (gray marks in figures), it
could be said that the amplification was small and that there was
no large difference among the tests. The amplitude of seaward
acceleration was slightly larger than that landward.
In the case of the test with 300Gal (black marks in figures),
the amplification tendency differed among the test cases. In the
case of quay walls with Type 1 and Type 2 blocks, the
acceleration amplitudes at the crown of the caisson were smaller
than in the test without blocks both seaward and landward; the
stability of the caisson was improved by the blocks. In the case
of Type 3 blocks, the amplitude seaward was larger than in the
test without blocks at the crown of the caisson, while the
amplitude landward was smaller. It was remarkable that the
amplitude at the head of the Type 3 block (a5) was much larger
in both directions.
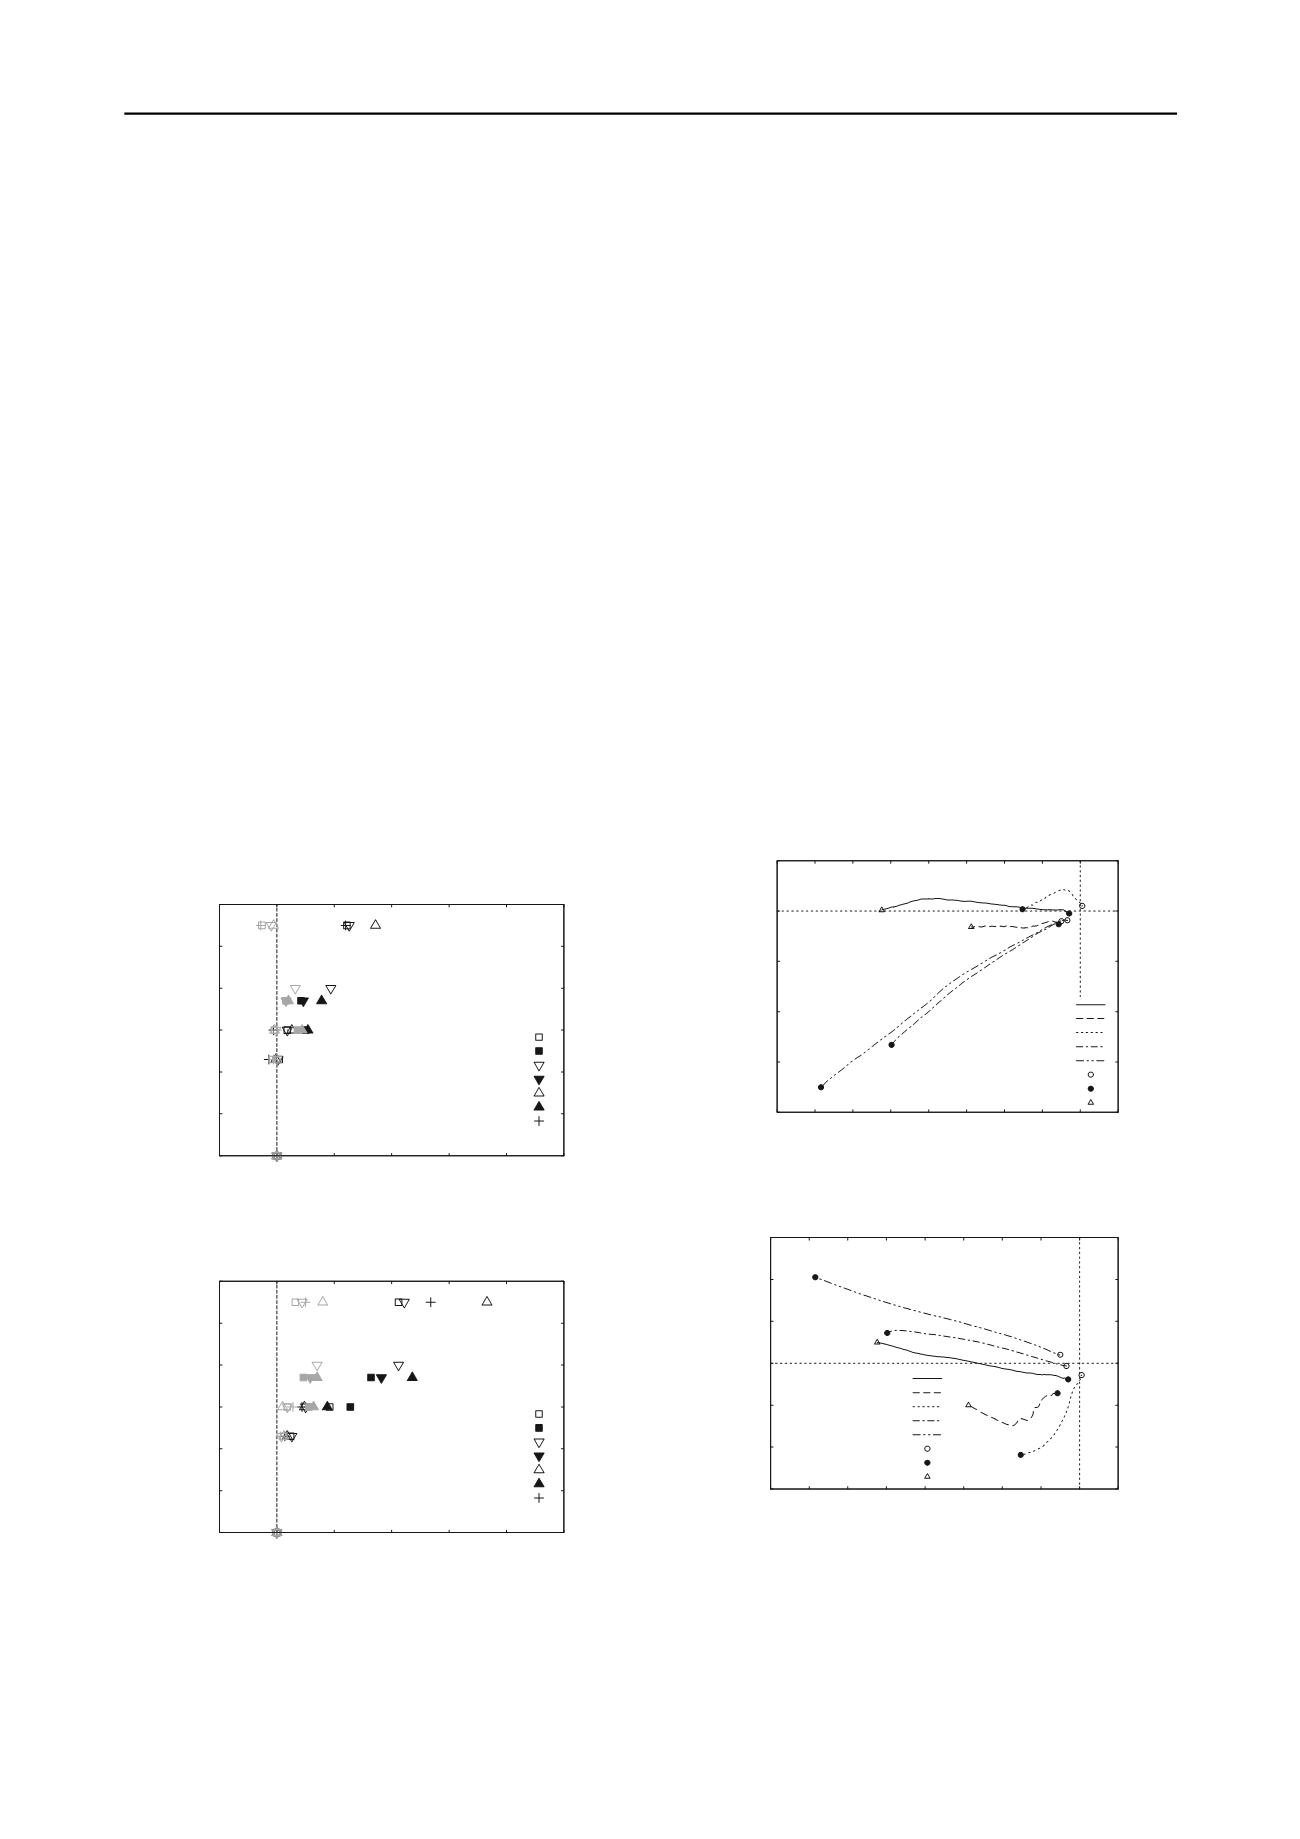
Figures 8 and 9 show the phase delay of the acceleration
observed in the tests. The phase delay was calculated in the
same way as acceleration amplitude. Figure 8 and 9 show that
there was no large delay in the case of the tests with 100Gal.
Large delay was detected in the landward acceleration observed
in the tests with 300Gal acceleration as shown in Figure 9. In
the tests with Type 1 and Type 2 blocks, the delay was the same
as in the test without any blocks. On the other hand, delay of
acceleration landward in the case of the test with Type 3 blocks
was much larger than in the case without blocks.
One of the causes of the large acceleration amplitude and
delay observed in the test with Type 3 blocks could be the
instability of the blocks because the shape was vertically long.
0
10
20
30
40
50
60
-0.1
0.0
0.1
0.2
0.3
0.4
0.5
elevation (cm)
phase delay (rad)
gray: 100Gal black: 300Gal
Type1 (a1-a4)
(a5,a6)
Type2 (a1-a5)
(a6)
Type3 (a1-a4)
(a5,a6)
without block (a1-a4)
Figure 8. Phase delay of acceleration seaward.
0
10
20
30
40
50
60
-0.1
0.0
0.1
0.2
0.3
0.4
0.5
elevation (cm)
phase delay (rad)
gray: 100Gal black: 300Gal
Type1 (a1-a4)
(a5,a6)
Type2 (a1-a5)
(a6)
Type3 (a1-a4)
(a5,a6)
without block (a1-a4)
Figure 9. Phase delay of acceleration landward.
4. DISPLACEMENT OF QUAY WALL
The trace of the top-left corner of the caisson in Figure 4 was
calculated from displacement measured by d1-d3 for each case.
Figure 10 shows the trace observed during the final step of
shaking. The maximum acceleration of the input wave for the
final shaking was deferent among the tests as mentioned before.
Tilt angle of the caissons was also calculated from the data of
displacement meter; Figure 11 shows the tilt angle observed
during the final step.
Figure 12 shows the deformation of the quay wall models
observed after the tests. A few millimeters of settlement of the
foundation ground were observed in all cases. Sand dropped
into clearance gap between the rubble mound and the sand box;
the boundary between the mound and the backfill ground was
not clear. Figure 12 shows the boundary in outline.
In the case of the model without blocks, the caisson moved
seaward with forward inclining as shown in Figures 11 and 12;
the large deformation observed with the input wave whose
maximum acceleration was 500Gal and the test was aborted
(see Figure 12). The caisson in the test with Type 4 blocks
showed similar behavior as in the test without blocks. Thus the
improved quay wall with Type 4 blocks was comparable in
seismic resistance to the quay wall before improvement in spite
of the front-water-depth enlargement. Figure 11 shows the
tilting of the caisson with Type 4 blocks smaller than the
caisson without blocks. The caisson with Type 4 blocks was
displaced with small rotation as shown in Figure 12. It could be
said that even small blocks like Type 4 had a certain degree of
effect on caisson stability.
-2.0
-1.5
-1.0
-0.5
0.0
0.5
-8 -7 -6 -5 -4 -3 -2 -1 0 1
vertical displacement (cm)
lateral displacement (cm)
Type1 (800Gal)
Type2 (800Gal)
Type3 (500Gal)
Type4 (500Gal)
without block (500Gal)
after 300Gal
after 500Gal
after 800Gal
Figure 10. Trace of the top-left corner of the caisson.
-15
-10
-5
0
5
10
15
-8 -7 -6 -5 -4 -3 -2 -1 0 1
tilt angle (degree)
lateral displacement (cm)
Positive angle means lean to the sea.
Type1 (800Gal)
Type2 (800Gal)
Type3 (500Gal)
Type4 (500Gal)
without block (500Gal)
after 300Gal
after 500Gal
after 800Gal
Figure 11. Relationship between tilt angle and lateral displacement of
the caisson.


