2020
Proceedings of the 18
th
International Conference on Soil Mechanics and Geotechnical Engineering, Paris 2013
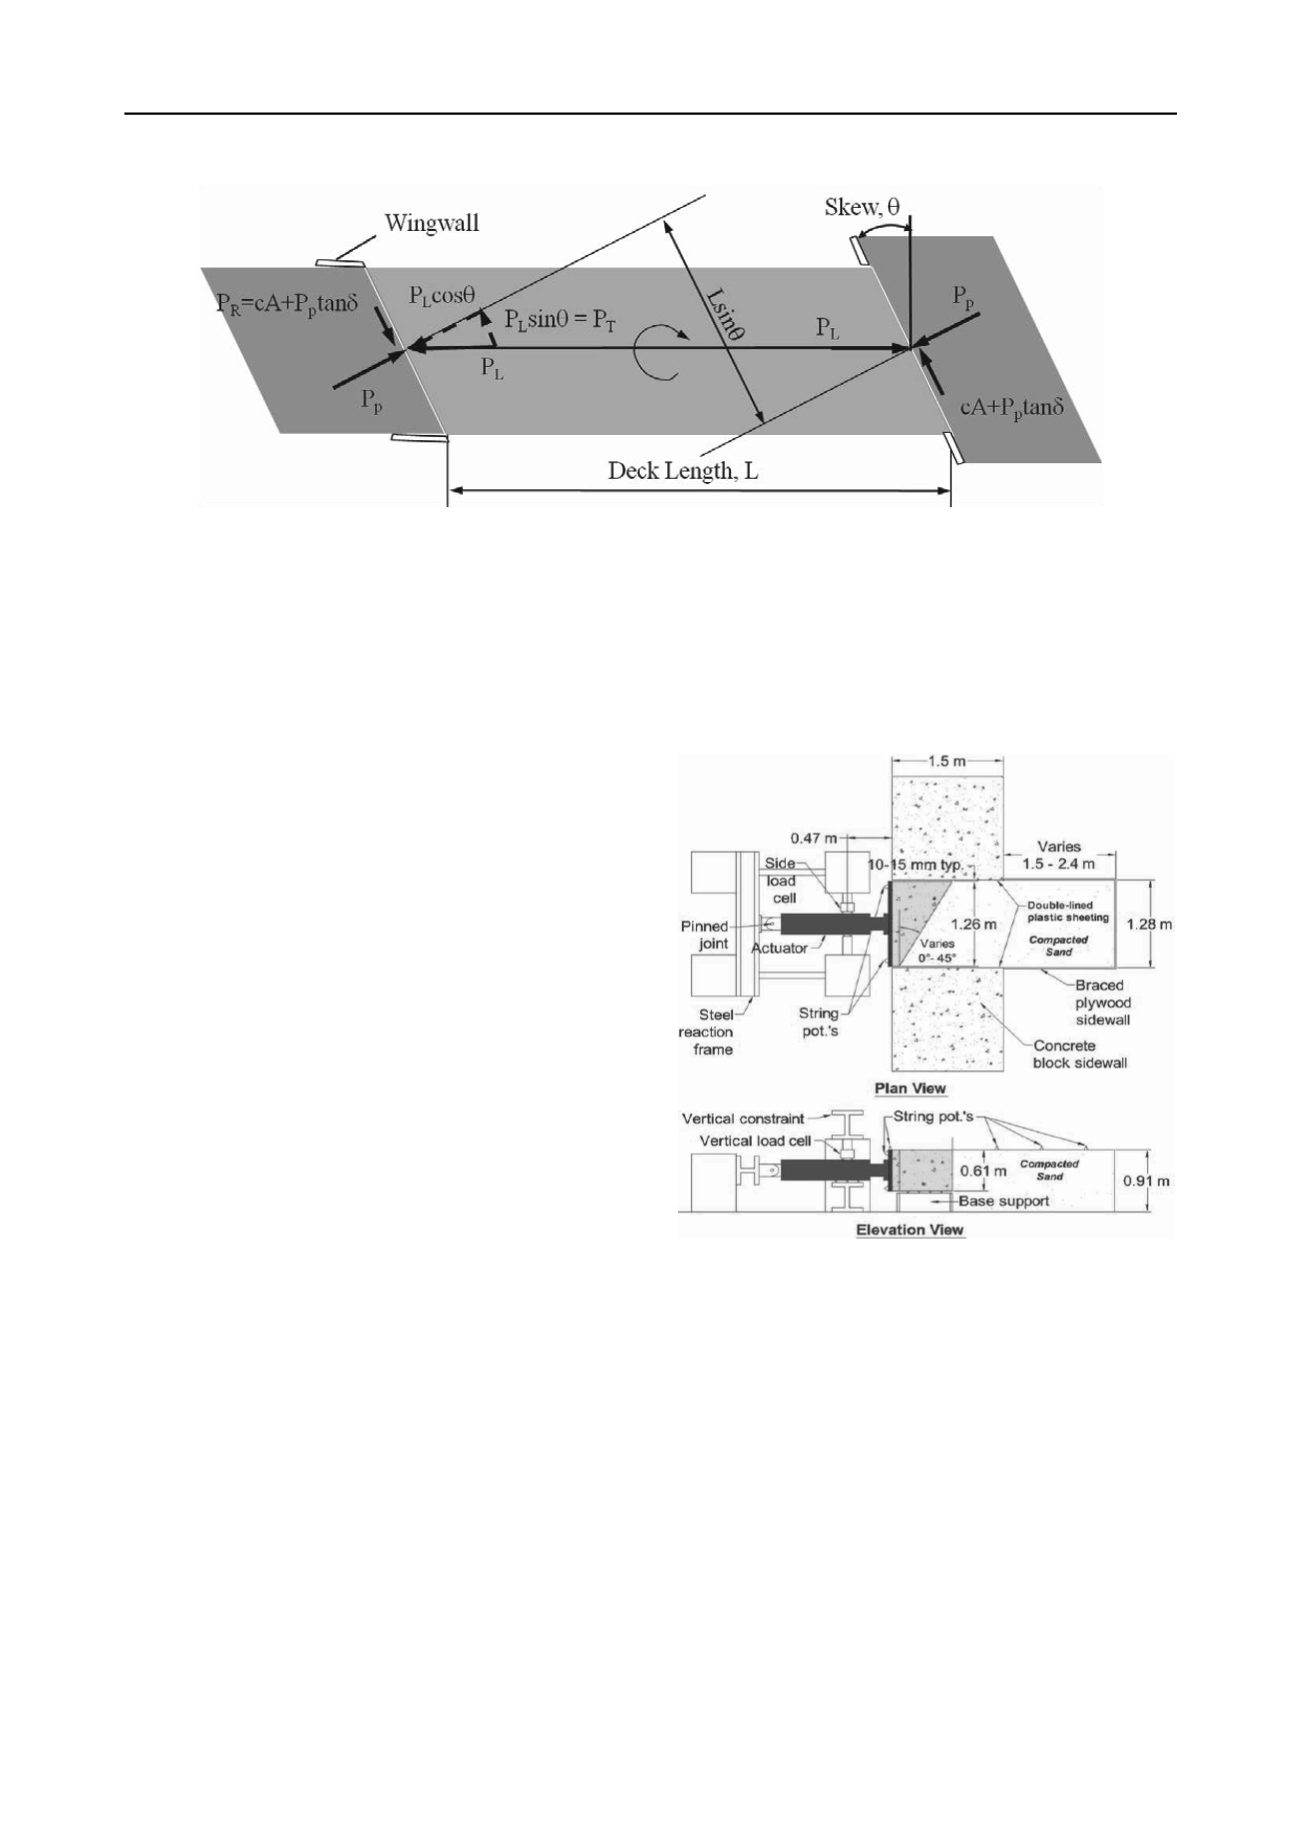
Figure 1. Illustration of forces acting on a skewed bridge at the soil-abutment interface
The transverse applied shear force (P
T
) can be computed
using the equation
P
T
= P
L
sin
(2)
while the transverse shear resistance (PR) can be given by the
equation
P
R
= cA + P
P
tan
(3)
Summing forces transverse to the backwall produces the
equation
(cA + P
P
tan
)/Fs ≥ P
L
sin
(4)
where c is the soil cohesion, A is the area of the backwall,
is
the angle of wall friction between the backfill soil and the
concrete abutment backwall, and Fs is a factor of safety. If the
applied transverse shear resistance exceeds the ultimate shear
resistance, the abutment could slide against the soil leading to
an unstable condition.
In addition, the offset in passive force on the abutments
produce a force couple which must be resisted by the force
couple produced by the shear resistances on each abutment.
Summing moments about a vertical axis leads to the equation
(cA + P
P
tan
) L cos
/Fs ≥ P
P
L sin
(5)
Again, if the shear resistance is insufficient, the bridge will
tend to rotate, which would likely change the distribution of
passive force on the abutments. Based on Eq 5, Burke (1994)
suggested that rotation would be expected for skew angles
greater than 15º with smooth abutment-soil interfaces and no
cohesion as the factor of safety dropped from 1.5 to 1.0. If
cohesion is ignored, the potential for rotation is independent of
both P
p
and the length of the bridge, L.
2 TEST LAYOUT
The test layout is illustrated in Fig. 2. A concrete wall 1.26 m
(4.13 ft) wide and 0.61 m (2 ft) high was used to model the
backwall of an abutment. Passive force-deflection tests were
performed with skew angles (
) of 0º, 15º, 30º, and 45º. Two
tests were performed for each skew angle to evaluate
repeatability. A dense sand was compacted behind the wall to
simulate the backfill in a typical approach fill. The sand
backfill was 0.9 m (3 ft) thick and extended 0.3 m (1 ft) below
the base of the wall. The backfill was 3 to 4 m (10 to 13 ft) long
to completely contain the failure surface and was slightly wider
than the wall 1.28 m (4.21 ft) to allow the backwall to move
into the sand backfill without any friction on the concrete
sidewall. To support the sand backfill during compaction, two
1.5 m concrete blocks were bolted to the structural floor of the
laboratory on either side of the fill near the wall. Beyond the
concrete blocks, plywood walls were braced into a vertical
position. Two plastic sheets were placed along the sidewalls of
the backfill to create a low friction surface and produce a 2D or
approximately plane strain geometry. A base was constructed
below the concrete backwall and rollers were placed at the
interface between the backwall and the base to provide a normal
force but minimize base friction.
Figure 2. Plan and elevation views of the test layout.
Tests were performed by pushing the backwall
longitudinally into the backfill sand using a 490 kN (110 kip)
hydraulic actuator which was bolted to the backwall. Load was
applied at a rate of 0.25 mm/min (0.1 inch/min); but sand is not
very rate sensitive. Vertical and horizontal load cells were
mounted between the reaction frame and the actuator so that the
loads necessary to hold the wall in place could be measured.
2.1
Instrumentation
Load was measured by pressure transducers in the actuator. To
measure the movement of the backwall, four longitudinal string
potentiometers were positioned at the corners of the wall and
two transverse string pots were positioned at the top and bottom
of one side. In addition, a final string pot was used to monitor
the vertical movement.
The position of the failure surface was monitored by
marking 0.3 m (1 ft) square grids at the backfill surface. The
subsurface failure plane position was located by placing vertical


