2024
Proceedings of the 18
th
International Conference on Soil Mechanics and Geotechnical Engineering, Paris 2013
level. The sublevels remained. A cross section through the
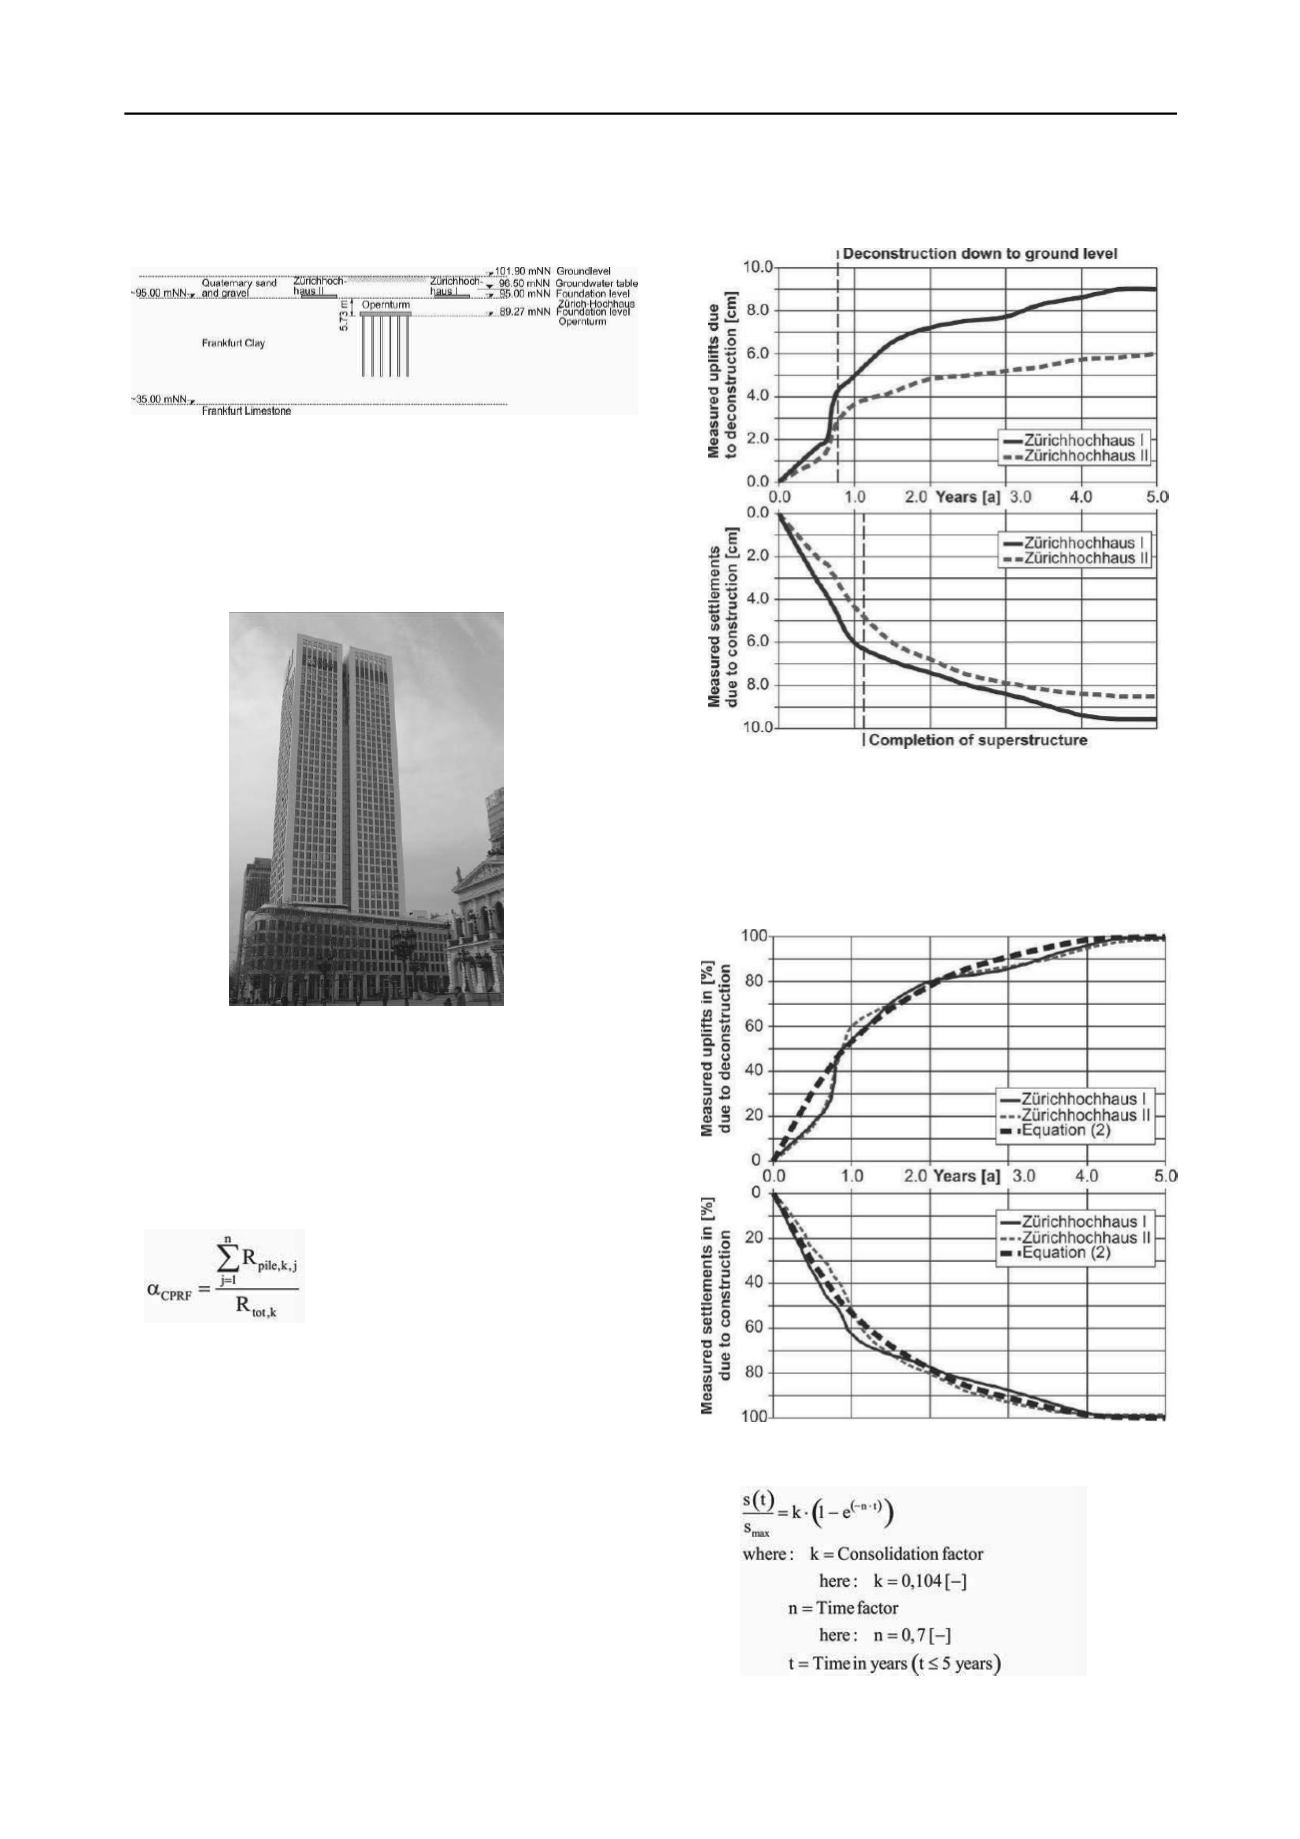
project area is shown in Figure 2.
Figure 2. Soil, groundwater and foundation conditions.
5 years after the deconstruction the 177 m high-rise building
Opernturm was built. The annexe of the high-rise building is up
to 7 storeys high (Fig. 3) and was founded on the existing raft
foundation. Under the Opernturm the existing raft was
deconstructed and a new sublevel was built.
Figure 3. New high-rise building Opernturm.
The Opernturm is founded on a Combined Pile-Raft-
Foundation (CPRF) consisting of a 3 m thick raft and 57 piles
with a diameter of 1.5 m and a length of 40 m. For design of the
CPRF a whole characteristic load of 1,500 MN was calculated.
The bearing behaviour of the CPRF is described by the CPRF-
coefficient α
CPRF
, explained in Equation (1) (Viggiane 1998,
Hanisch et al. 2002). The Operturm has a α
CPRF
= 0.9.
(1)
The soil and groundwater conditions are typical for the inner
city of Frankfurt am Main:
- 0 m to 7 m: quaternary sands and gravel
- 7 m to 67 m: Frankfurt Clay
- below 67 m: Frankfurt Limestone
- groundwater level in a depth of 5.5 m
The measured settlements during the construction of the
Zürichhochhaus I and II as well as the uplift during their
deconstruction are depicted in Figure 4. The measured
settlements increase continuously up to 60 % of the final
settlement during the construction time of the superstructure.
Due to the consolidation process the deformation rate decreases
continuously. About 5 years after the construction the
settlement stopped at 9.5 cm at Zürichhochhaus I and 8.5 cm at
Zürichhochhaus II. The deconstruction started in the middle of
2001. In March 2002 the deconstruction was completed. Only
the sublevels were kept. After 5 years the measured uplift is in
the same magnitude as the settlements before.
Figure 4. Measured settlements and uplifts of the soil in the area of the
high-rise buildings.
The measured time dependent settlement and uplift evolution
with reference to the maximum value can be approximately
mathematically described by Equation 2. Figure 5 shows the
application of Equation 2 to the presented project.
Figure 5. Measured settlement and uplift and correlation to Equation 2.
(2)
(3)


