2033
Technical Committee 207 /
Comité technique 207
principle of the weakest link in the chain, there starts a
mechanism that occurs at the lowest load level, although in the
following load steps some additional mechanisms may also
occur.
The bond lengths (2.2 m) of the shortest anchor units
(RCP/D-Z and RCP/D-I anchors) were determined according to
the available anchor bond length 7 m and previous experience
(Barley and Windsor, 2000, Bruce et al., 2007). The bare
strands of the bond length of RCP/D and RCP/D-K anchors
were spirally rotated along the longitudinal axis, while the
strands of the short bond length of RCP/D-Z and RCP/D-I
anchors were straight. The bare strands of the bond length of
RCP/D anchors (and to a certain extent of RCP/D-K anchors)
were additionally arranged in a pattern of alternating spatial
extension and compression of strands. Although the lengths of
strand bond lengths were selected in accordance with the
aforementioned recommendations, the analysis of the in-situ test
results of RCP/D-Z and RCP/D-I anchors showed predominant
mechanism of pull-out of strands bond length from cement
grout inside the corrugated PE duct. Such behavior can be
associated with the greasing technology of strand free length, in
which some strands in bond lengths can be locally stained with
vaseline, although most of the stains were later on removed.
Contrary to expectations, only in individual cases of RCP/D and
RCP/D-K anchors, there appeared the pull-out mechanism of
the whole tendon from the cement grout inside corrugated PE
duct. Such behaviour can be partly ascribed to the local
contamination of bare strands with vaseline stains, and partly to
the direct contact of strand bond lengths with the bottom part of
the corrugated PE duct (no minimum grout cover was
provided).
The behaviour of anchor bond length is reflected in the most
important outcome of the IT: pull-out resistance
R
a
, which is
determined as the intersection of experimentally obtained curve
of interval creep displacement rate
k
int
to the assumed margin
that denotes the failure of an anchor
k
crit
= 2 mm. In cases where
such intersection does not exist, the failure of anchor bond
length is not reached – in these cases the standard SIA 267/1
allows for an extrapolation of
R
a
as a proof load extrapolated up
to 10%. The problem with this assessment remains when the
anchor bond length can be assessed as failed, or in other words,
in those cases when it is a reasonable to expect that the anchor
bond length would be able to sustain a load of 1.10
P
pv
. The
analysis of in-situ obtained test results for the considered type of
anchors showed: if the following criteria are satisfied, this could
be a suitable basis for 10 % extrapolation of
P
pv
, provided that
the estimate is made by an experienced specialist:
• linear trend approximation of the creep displacement rates
at the proof load
pv
(considering all strands and the anchor as a
whole) should not exhibit any noticeable increase in creep rate,
• maximum creep displacement rate in each time interval
after the second minute of observation (for each strand and the
anchor as a whole) must not exceed the criterion of failure
k
crit
,
• the interval creep displacement rate
k
int
(
P
pv
), of each strand
and the anchor as a whole should not be greater than 1.35.
Results of all performed in-situ tests are presented as values
of pull-out resistances
R
a
[kN] (Table 1) as well as in the
diagrams of interval creep displacement rates
k
int
obtained at all
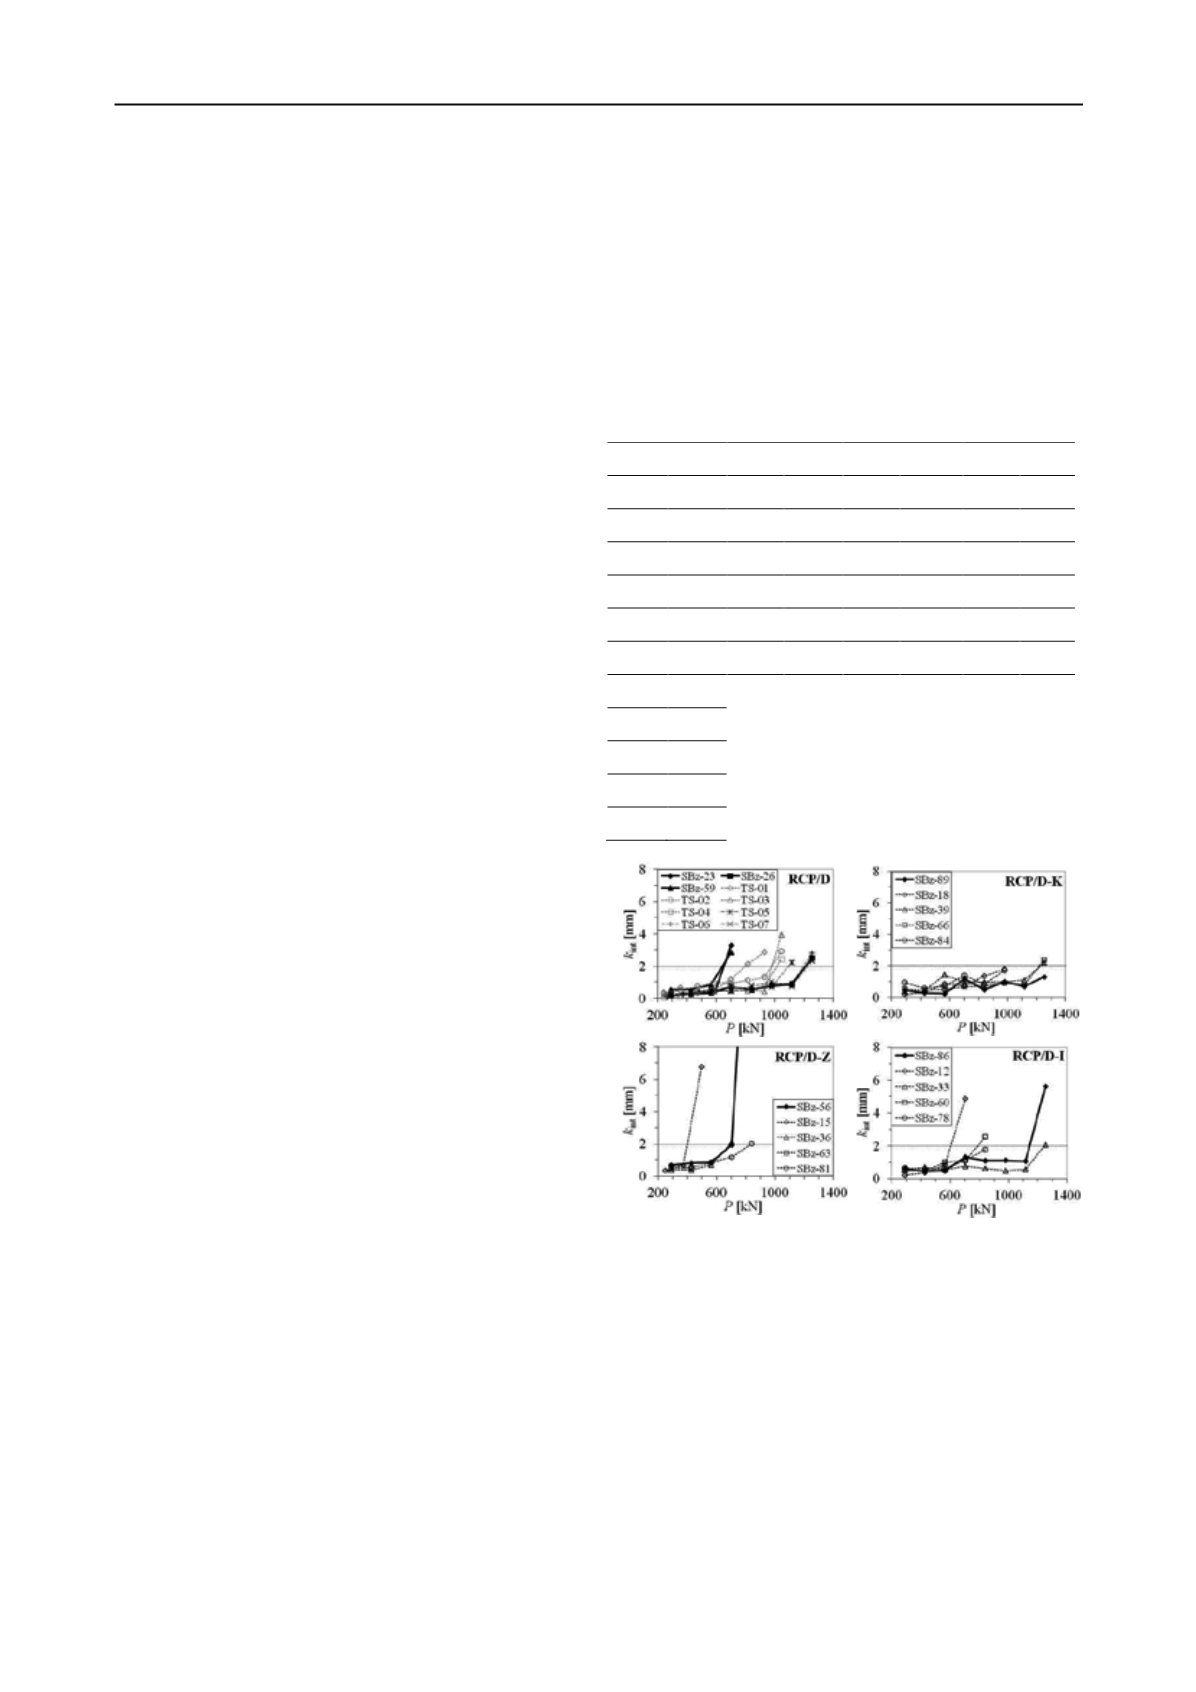
stages of IT and CST (Fig. 4).
The general impression in the ratio of pull-out resistances
among various types of tested anchors can already be obtained
on the basis of visual assessment of the curves in the diagrams:
the highest values of anchor bond length resistance (i.e. high
loads
P
reached at low values of
k
int
) were achieved at RCP/D-
K anchors with increased stiffness of bond length, which
slightly exceeded the bond length resistance of reference RCP/D
anchors. An unexpectedly rapid failure of two reference RCP/D
anchors was a result of problems at grouting (anchor SBz-23)
and distinctive slip of two strands, probably due to bare strand
contamination with vaseline (anchor SBz-59). On the other
hand, multiple anchors with staggered bond lengths (RCP/D-Z
type) demonstrated the poorest performance of all tested
anchors due to early failure of bond lengths at low load stages
of IT or CST (deterioration of bond between strands and cement
grout resulted in the pull-out of the strands). The behaviour of
RCP/D-Z and RCP/D-I anchors was probably influenced by the
surface contamination with vaseline as well as configuration of
strands in the bond length. Additional impairment of the
conditions within the corrugated PE duct was caused by the use
of soft and relatively spacious packing connections in the
transition between anchor unit bond and free length.
Table 1. Results of in-situ tests: pull-out resistances
R
a
[kN] of all tested
anchors of reference and alternative types.
RCP/D
RCP-D/K
RCP-D/Z
RCP-D/I
Anchor
R
a
[kN] Anchor
R
a
[kN] Anchor
R
a
[kN] Anchor
R
a
[kN]
TS-01*
800 SBz-89* 1254 SBz-56* 702 SBz-86* 1144
TS-02*
979 SBz-18
#
978 SBz-36
#
694 SBz-12
#
604
TS-03*
981 SBz-39
#
1231 SBz-63
#
469 SBz-33
#
1248
TS-04* 1015 SBz-66
#
1220 SBz-81
#
837 SBz-60
#
789
TS-05* 1095 SBz-84
#
978 SBz-15
#
400 SBz-78
#
840
TS-06* 1195
TS-07* 1227 *… Result of IT.
SBz-23* 651
#
… Result of CST.
SBz-56* 1211
SBz-59* 642
Figure 4. Interval creep displacement rates
k
int
for reference testing
anchors as well as for all types of alternative anchors.
To confirm the relationships among pull-out resistances
R
a
(Table 1) a one-sided Student’s T-test with unequal variance
was used to check whether the average values of different types
of anchors differ significantly from each other.
Results of testing the hypothesis of the equality of the means
of two normal populations at the 5 % significance level showed
that the mean value of RCP/D-Z anchor pull-out resistance was
statistically typically lower than the mean values of pull-out
resistance of reference RCP/D and alternative RCP/D-K
anchors (Table 2). Somewhat unexpectedly, using statistical
methods we could not confirm that the mean value of RCP/D-Z
anchor pull-out resistance was statistically typically lower than
the mean value of pull-out resistance of RCP/D-I anchors, as it
could be inferred only on the basis of visual comparison of the
curves in the graphs in Fig. 4.


