2041
Technical Committee 207 /
Comité technique 207
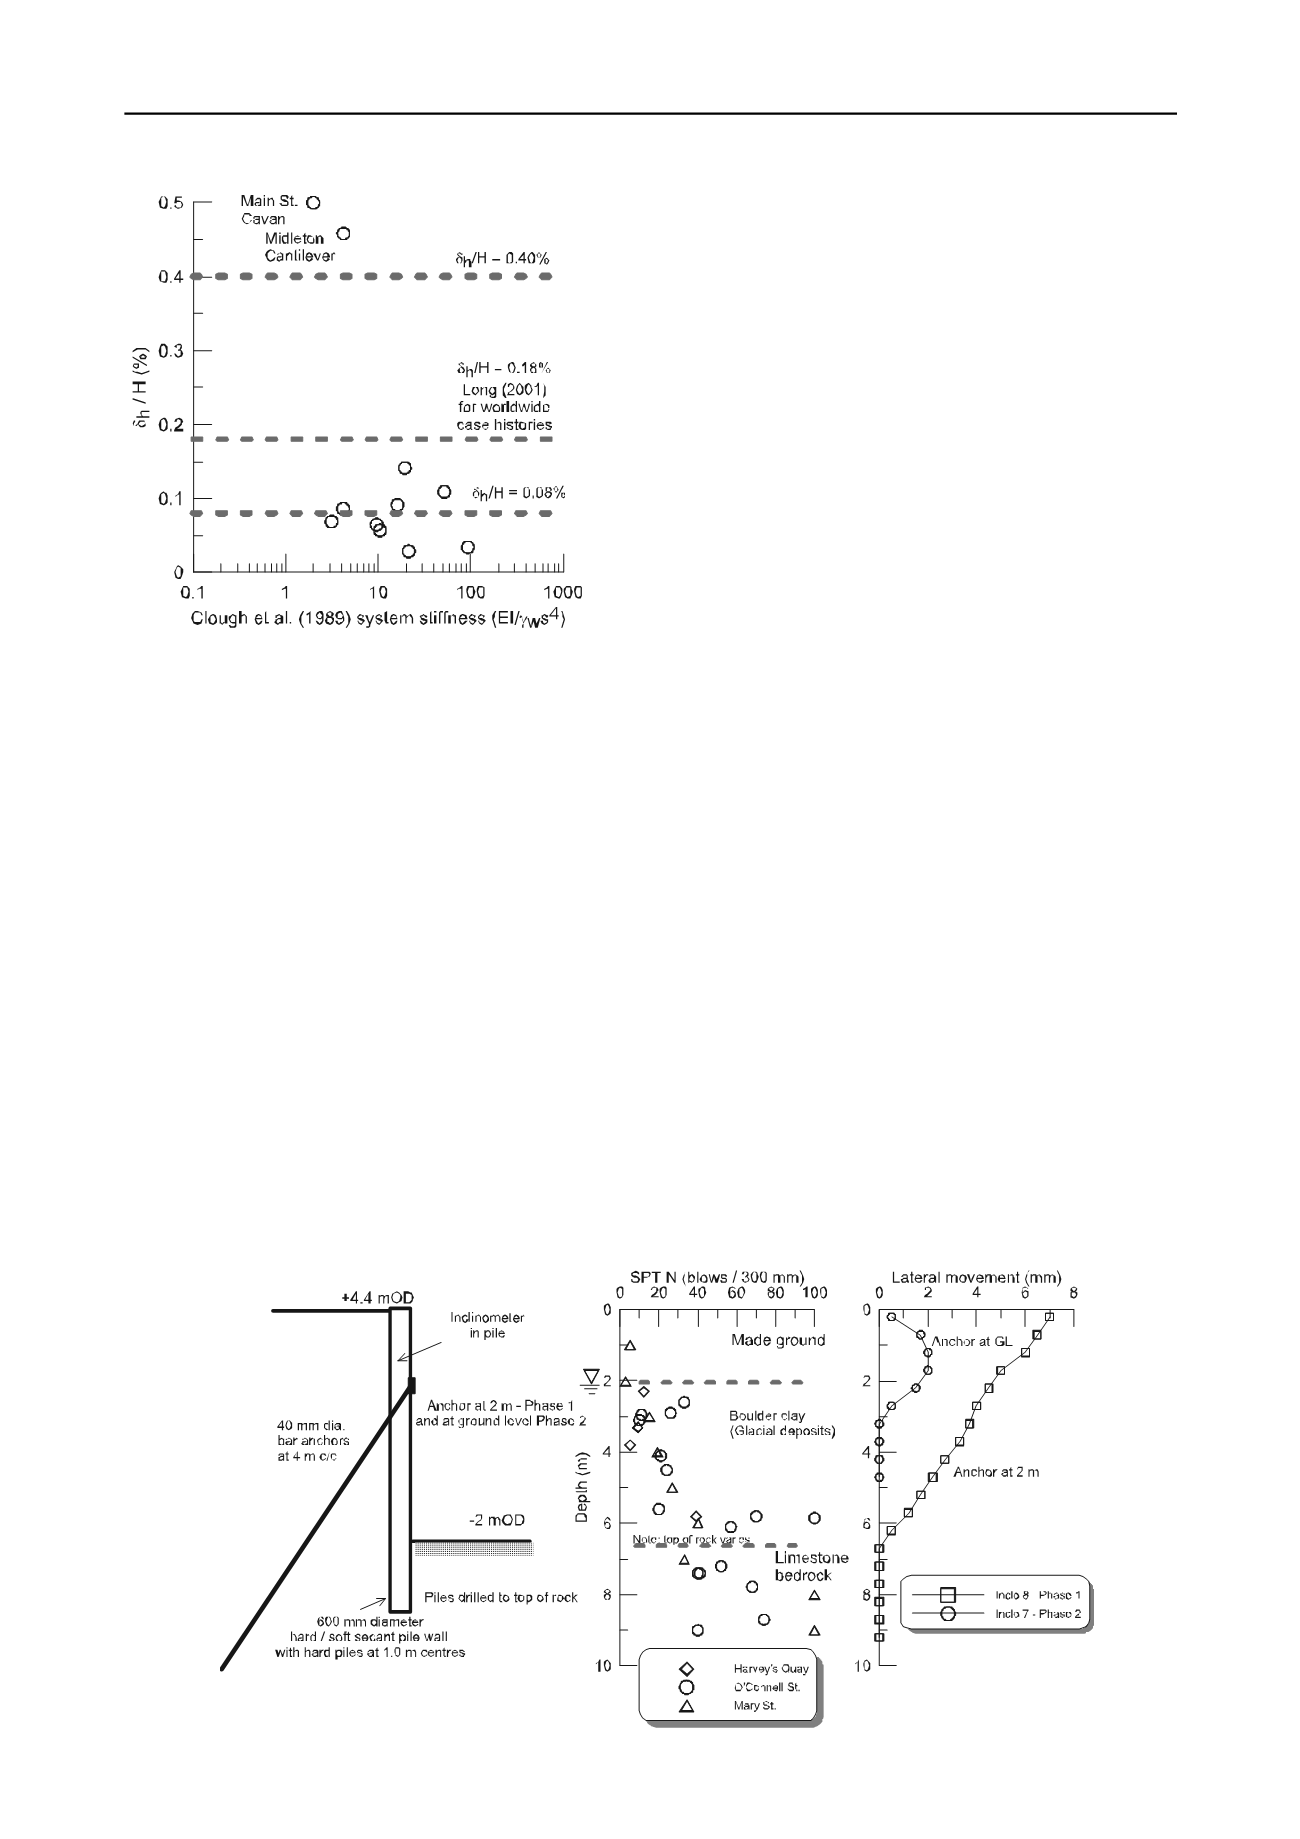
Figure 3. Normalised maximum lateral wall movement versus Clough et
al. (1989) system stiffness
The two relationship included in Figure 2 are also shown
here. In addition the relationship
h
/H = 0.18, which was
obtained by Long (2001) for an average of 169 case histories
worldwide where there was stiff soil at dredge level, is also
shown. Lateral movement is clearly a function of system
stiffness with the two walls with low system stiffness showing
relatively high movements. The Cavan wall had very slender
piles and the Midleton wall had no props or anchors. However
the remaining data plot well below the worldwide trend
suggesting that a more flexible (and hence a more economic)
wall may perform adequately in many cases.
Some of the trends shown on Figure 2 and 3 are explored
further by examining two detailed case histories as follows
6 CASE HISTORY OF A LIGHTLY SUPORTED
“REGULAR” WALL – SAVOY, LIMERICK
Details of this site are shown on Figure 4. The approach and
techniques use at the Savoy Site are typical of those used at
many sites in Ireland. The site is underlain by about 2 m of
made ground over about 5 m of glacial deposits over limestone
bedrock. The glacial deposits have standard penetration test
(SPT) N values increasing from about 20 blows / 300 mm near
the top of the stratum to an average of 60 blows / 300 mm with
depth.
Figure 4. Savoy, Limerick
The retaining wall was required for temporary works
purposes only and comprised a 600 mm diameter “hard / soft”
secant wall with a single anchor. For the Phase 1 excavation the
anchor was located at about 2 m depth. Much of the 7 mm or so
movement recorded occurred while the wall was acting in a
cantilever mode during the installation of the anchors. This is
consistent with the findings of Long (2001) for a good number
of world wide projects. Thus for Phase 2 the anchor was
relocated to ground level and the measured movements were
much smaller.
It would seem that a less stiff system, e.g. smaller diameter /
more widely spaced piles or a cantilever wall would have
performed perfectly adequately in this case.
7 CASE HISTORY OF CANTLEVER WALL
Details for the Midleton site are shown on Figure 5. This project
was carried out in 2012 and thus many of the lessons learned
over the previous 10 to 15 years could be used. Again the wall
was required for temporary works purposes. It comprised a
“hard / firm” secant pile wall with 640 mm diameter structural
“male” piles and 900 mm diameter “female”. A single anchor
was used at locations where sensitive adjacent buildings were
present. However for non sensitive areas of the site and based
on the experiences listed above a cantilever solution was used.
Ground conditions are more complex than those at Limerick
and comprised a variable sequence of glacial clays, silts, sands
and gravels. SPT N values increase from about 10 blows / 300
mm at the surface to an average of 25 blows / 300 mm at 7 m
depth and thereafter remain approximately constant.
As would have been expected from previous experience
measured movements for anchored section were very small. For
the cantilever sections the wall also behaved very well and
maximum lateral movements were of the order of 20 mm
Predicted wall deflections, using FREW
®
for the anchored
wall are also shown on Figure 5. The key input parameters are
the effective friction angle (
'), the undrained shear strength (s
u
)
and the Young’s modulus (E
u
or E'). These were determined
from correlations with SPT N. For the clay layers it was
assumed s
u
= 5N and E
u
= 750N (Gaba et al., 2003; Stroud,
1988). For the granular soils E' was assumed = 2500N and
'
was found from the relationships of Peck et al. (1974).
It can be seen that the predicted values considerably
overestimate the measured ones. A similar finding was made for
the cantilever wall at Midleton.


