2044
Proceedings of the 18
th
International Conference on Soil Mechanics and Geotechnical Engineering, Paris 2013
Β
wall
Η
backfill
foundation soil
D
fixed in both directions
fixed in the
horizontal
direction
fixed in the
horizontal direction
node C
-prescribedhorizontalDOF
-freeverticalDOF
node Τ
-prescribedhorizontalDOF
-freeverticalDOF
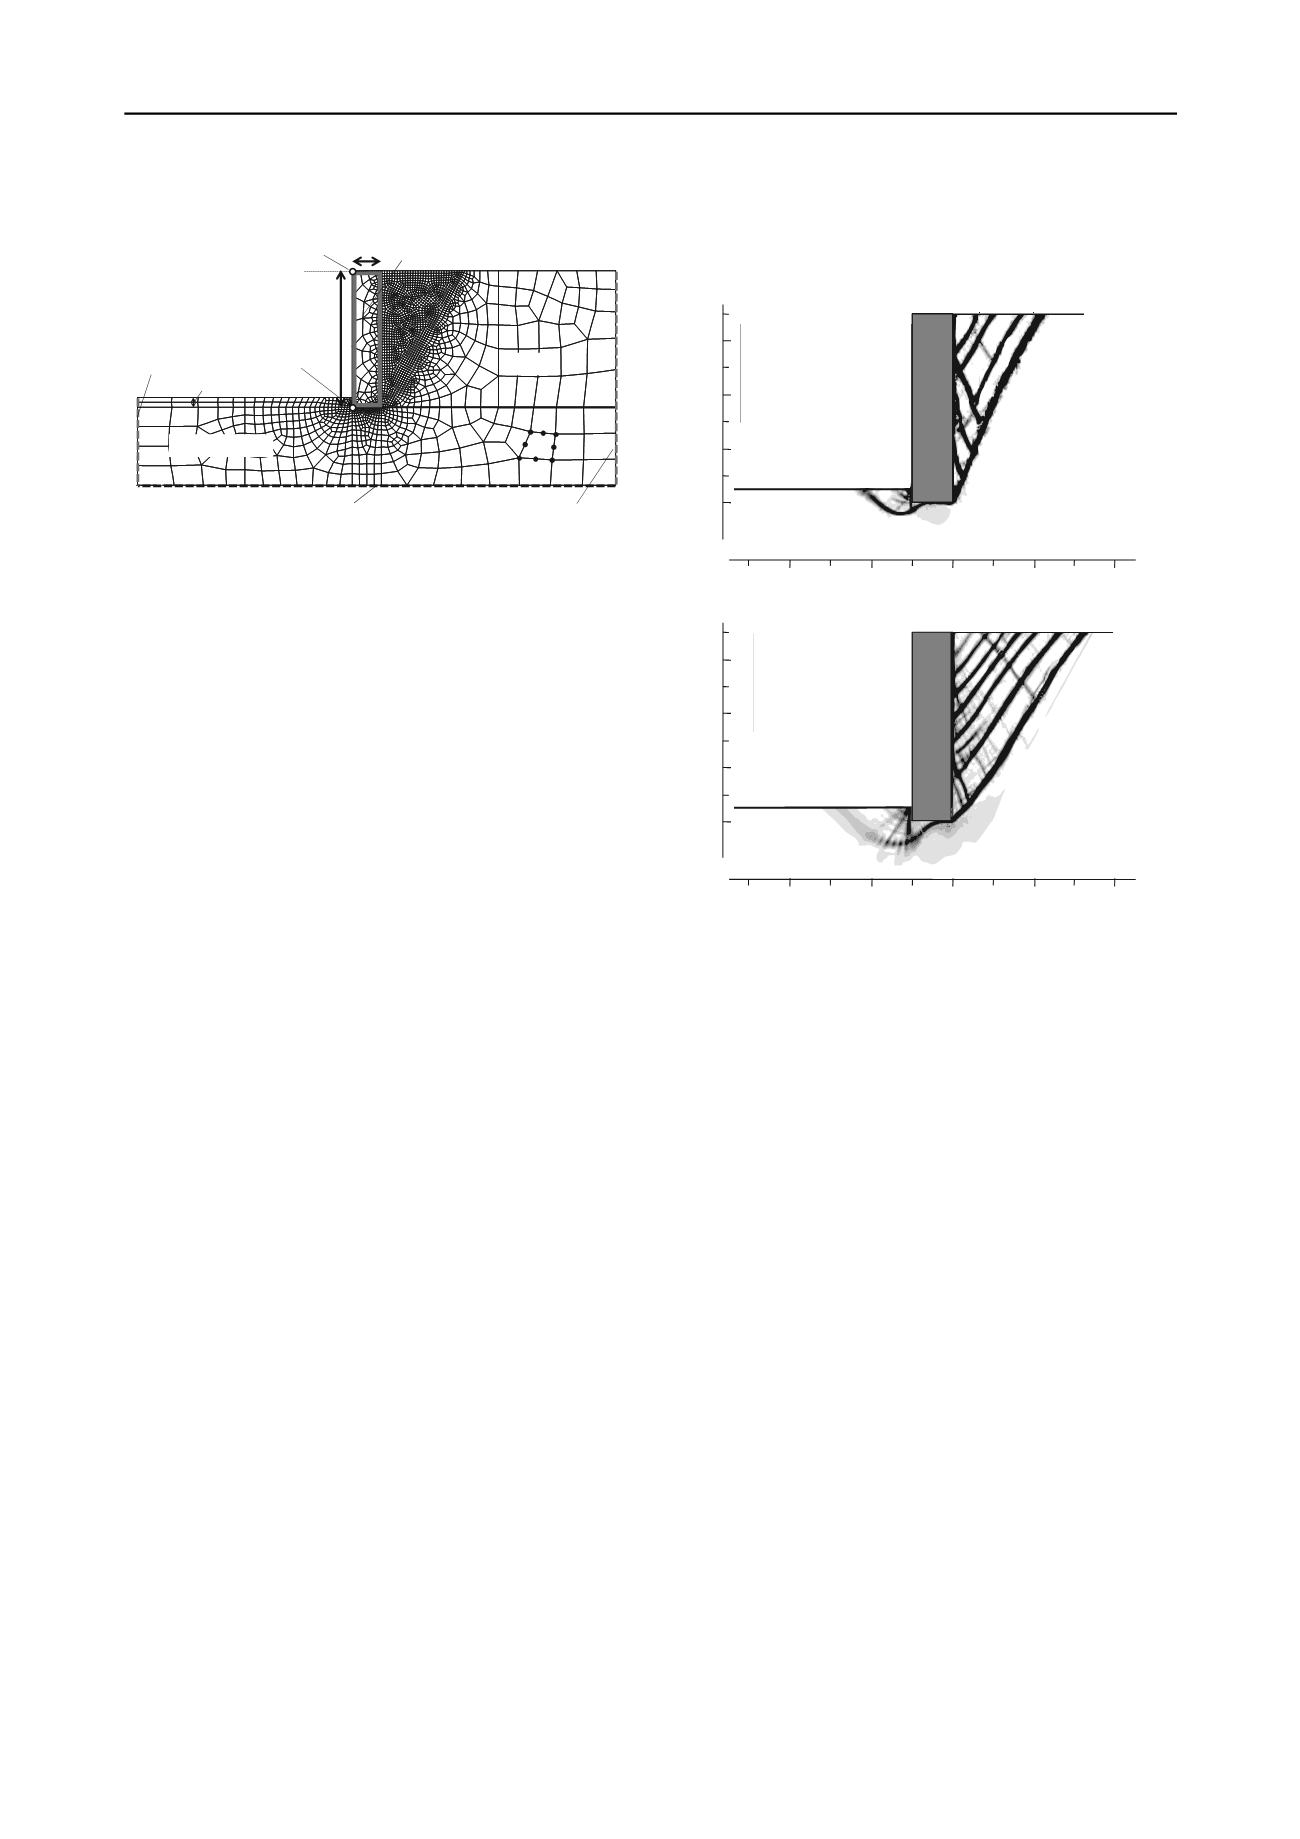
Figure 1. Typical mesh and boundary conditions used in the FE
analyses.
The constitutive model used in this study is the two-surface
plasticity model based on critical state soil mechanics developed
originally by Manzari and Dafalias (1997) and subsequently
modified by Dafalias et al. (2004) and Loukidis and Salgado
(2009). The model parameters were determined by Loukidis and
Salgado (2009) for two sands: air-pluviated/dry-deposited
Toyoura sand and Ottawa sand. The model takes into account
inherent and stress-induced anisotropy, and predicts accurately
the soil response at both small and large strain regimes.
Because the problem under investigation involves material
softening, the numerical simulations were inherently unstable.
For this reason, the analyses were performed under
displacement control. In the beginning of the analysis, the wall
is fully supported at two points, namely the crest (node C) and
the toe (node T), shown in Fig. 1, where the corresponding
horizontal reactions are
R
C,0
and
R
T,0
, respectively. Equivalently,
the wall is initially prevented to move horizontally or rotate
because of the external application of a horizontal force
F
ext,0
=
R
C,0
+
R
T,0
and a moment
M
ext,0
=
R
C,0
/
H
. The analysis proceeds
by the application of horizontal displacement increments
u
C
and
u
T
pointing away from the retained soil. As a result, the
reactions
F
ext
(=
R
C
+
R
T
) and
M
ext
=
R
C
/
H
begin to decrease.
These displacement increments are applied in such way that the
ratio
F
ext
/
F
ext,0
is maintained equal to the ratio
M
ext
/
M
ext,0
. As a
consequence, the prescribed displacements
u
C
and
u
T
are not
equal to each other, leading to an overall wall motion that
includes both translation and rotation. The wall is allowed to
move vertically as no restraints are imposed on its nodes in the
vertical direction.
3
SIMULATION RESULTS
Finite element analyses were performed for
B
ranging from
1.5m to 2.5m and
H
ranging from 6m to 8m. The sand unit
weight
was set equal to 18kN/m
3
, while the coefficient
K
0
was
set equal to 0.5. For the sake of simplicity, the foundation soil is
assumed to be of the same type and density as the retained soil.
3.1
Failure mechanism
Fig. 2 shows contours of the incremental maximum shear strain
max
at the final stages of the simulations. The failure
mechanism inside the supported soil consists of a wedge shaped
sliding mass delimited by the wall backface and an oblique
shear band originating from the heel of the wall. It can be seen
also that families of secondary shear bands develop inside the
sliding wedge. This is consistent with experimental
observations by Leśniewska and Mróz (2001), as well as with
FE analysis results by Gudehus and Nubel (2004). As shown in
Fig. 2, the inclination angle of the shear bands in the retained
soil mass with respect to the horizontal is larger in the case of
dense than loose sand. A shear band running parallel to the wall
back face also forms in all analyses, representing sliding
between the sliding soil mass (wedge) and the wall.
yo60
0.0 3.0 6.0
-3.0
-6.0
0.0
2.0
4.0
6.0
Η=7m
B=1.5m
D=0.5m
D
R
=90%
(m)
(m)
Η=7m
B=1.5m
D=0.5m
D
R
=45%
(a)
(b)
0.0
2.0
4.0
6.0
(m)
0.0 3.0 6.0
-3.0
-6.0
(m)
Figure 2. Contours of incremental
max
from analyses with dense and
loose Ottawa sand.
Below the wall base, a bearing capacity mechanism forms,
the shape of which resembles that of mechanisms presented by
Loukidis et al. (2008) for the case of strip footings on purely
frictional material and subjected to eccentric and inclined
loading.
3.2
Active earth pressure evolution
Fig. 3 illustrates how the normal (horizontal) stress distribution
along the back of the wall changes during an analysis. At the
beginning, there is the triangular stress distribution
corresponding to geostatic stress conditions (
K
=
K
0
). With
increasing wall displacement, the horizontal stress decreases
progressively until a minimum active pressure state (MPS) is
reached. From that point on, the average horizontal stress
increases, but at a much lower rate than the rate at which it
decreased earlier. Although before the MPS the stress
distribution is smooth, afterwards, local peaks and valleys
develop as consequence of bifurcation and the shear banding
inside the sliding mass.
The evolution of the lateral earth pressure coefficient
K
with
crest displacement
u
C
is shown in Fig. 4 for analyses with
Toyoura sand with 60% relative density but different values of
H
,
B
, and
D
. It can be seen that
K
drops sharply towards a
minimum value (
K
A,min
) corresponding to MPS at
u
C
approximately equal to 0.003
H
and, subsequently, rises
smoothly, approaching a residual value (
K
A,cr
) related to the full
development of critical state inside the sliding wedge. The
results in Fig. 4 suggest that
K
A,min
and
K
A,cr
are practically
independent of the wall dimensions and the embedment.
Fig. 5 shows the
K
/
K
0
evolution for Toyoura and Ottawa
sands with different values of relative density. The figure also


