2040
Proceedings of the 18
th
International Conference on Soil Mechanics and Geotechnical Engineering, Paris 2013
Figure 1. Location of study sites
Table 1. Details of study sites
Site No.
Location
H
(m)
Support
Configuration
Wall type
1
Savoy
Limerick 1
6.4 Single anchor
Secant
2
Savoy
Limerick 2
5.8 Single anchor
Secant
3
Main St.
Cavan
9.0 Two anchors Contiguous
4
Dundalk
Cellar
8.7 Single anchor
Secant
5
Dundalk
Bunker
8.1 Single anchor
Secant
6
Midleton
Cantilever
6.0
Cantilever
Secant
7
Midleton
Anchored
6.0 Single anchor
Secant
8
Kilkenny 7.7 Single prop Contiguous
9
Kilkenny
6.9 Single prop Contiguous
10
Shaws
Carlow
5.0 Single prop
11 Portlaoise SC
Phase 1
12.0 Two anchors
Secant
12 Portlaoise SC
Phase 2
7.0 Single anchor
Secant
Table 1 continued
Site No
Pile dia. (mm) /
spacing (m) / length (m)
h
max
(mm)
Reference
1
600 / 1 / 8.4
7
BLP files
2
600 / 1 / 7.8
2
BLP files
3
192 / 0.25 / 14
45
BLP files
4
640 / 1.4 / 10
6
BLP files
5
640 / 1.4 / 12
7
BLP files
6
640 / 1.2 / 16.5
27.5
BLP files
7
640 / 1.2 / 14
5.5
BLP files
8
600 / 0.75
5
Arup files
9
600 / 0.75
2
Arup files
10
n/a
2 NVM files
11
640 / 1.0 / 14
17
BLP files
12
640 / 1.0 / 7
4
BLP files
4 DESIGN
Current geotechnical design procedures for retaining walls in
Irish glacial deposits often involves the following steps:
A. Following the general guidelines of Gaba et al. (2003) or
BS8002 (BSI, 1994), for ultimate limit state, determine the
required retaining wall toe penetration. Calculations use
effective stresses and are often performed by hand, using
conventional Rankine active and passive earth pressure
theory, or with a relatively simple piece of software,
B. Check that this toe penetration is adequate to support any
vertical loads and also to prevent significant water seepage,
C. Determine wall bending moments, shears, prop / waler
forces and lateral wall movements (serviceability limit state)
by means of a beam – spring computer program such as
OASYS – FREW
®
,
D. Determine the associated ground movements using
empirical based methods, such as those developed by
Clough and O’Rourke (1990). Possible adjacent building
damage is then assessed by comparing parameters such as
differential settlement with empirically based tolerable
limits, e.g. those of Burland et al. (1977)
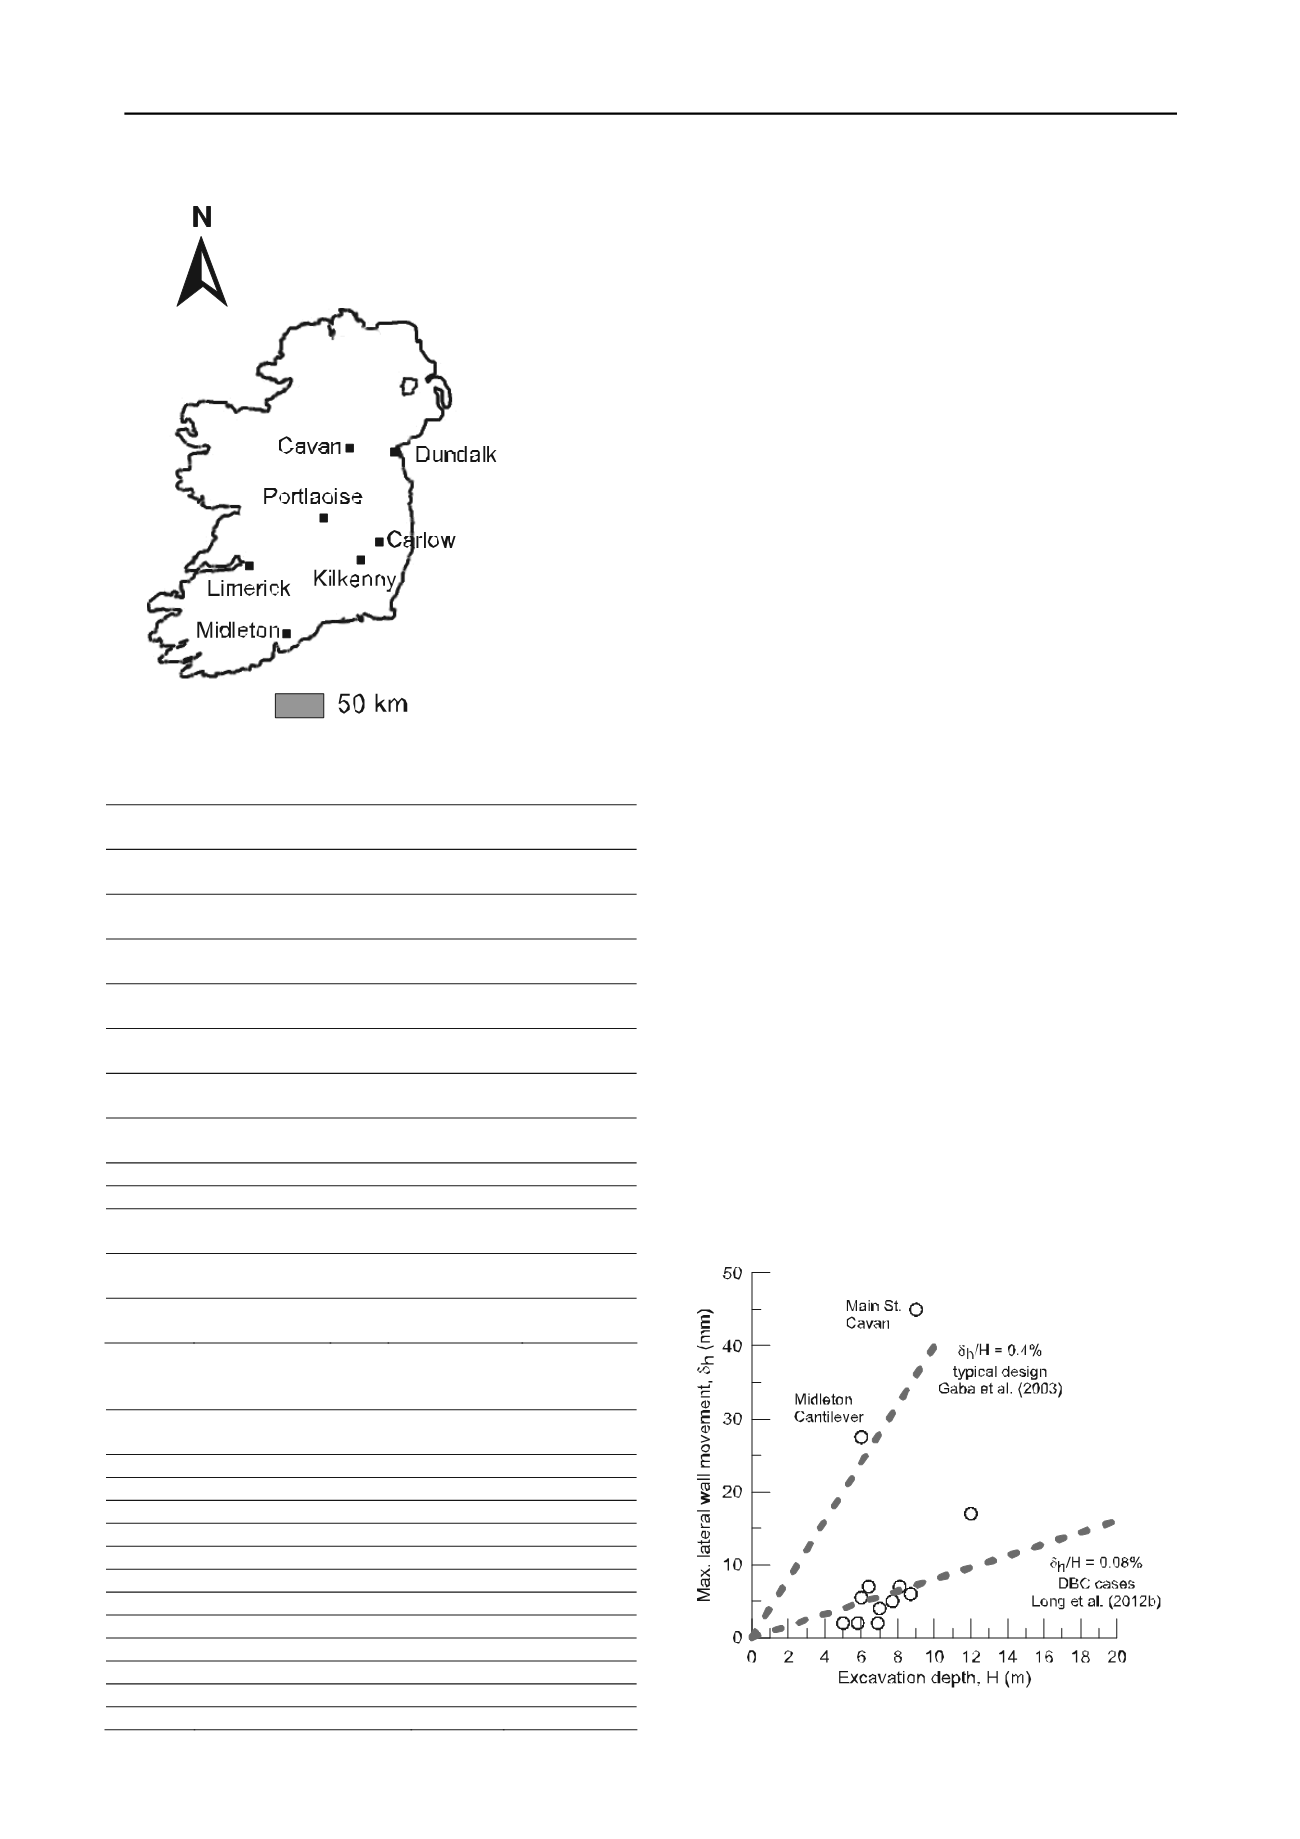
5 OVERVIEW ALL SITES
Data for the 12 available case histories are presented in Table 1.
A plot of maximum measured lateral movement (
h
) versus
retained height (H) is shown on Figure 2. Except for the Main
St. Cavan, Portlaoise Phase 1 and the Midleton cantilever
excavations,
h
values are less than 7 mm. There does appear to
be some weak tendency for an increase in
h
with H.
Also shown on Figure 2 are lines representing normalised
movement (
h
/H) of 0.08% and 0.4%. The former relationship
was obtained by Long et al. (2012a) for projects in Dublin
boulder clay – a very stiff glacial lodgement till. The behaviour
of the projects presented here is similar if not better than the
Dublin sites. The 0.4% line represents a typical design value as
recommended by Gaba et al. (2003) in CIRIA Report C580 and
clearly this relationship is very conservative for most of the
cases presented but is consistent with the data from the Cavan
and Midleton cantilever sites.
The data shown on Figure 2 takes no account of the
retaining wall type, its stiffness or the prop / anchor
configuration. In order to attempt to include these factors, the
data are replotted on Figure 3 in the normalised form of
h
/H
against Clough et al. (1989) system stiffness. This is defined on
Figure 3 where EI = wall stiffness,
w
= unit weight of water (so
as to make expression unitless) and s = support spacing.
Figure 2. Maximum lateral wall movement versus excavation depth


