2021
Technical Committee 207 /
Comité technique 207
columns of red sand spaced along the longitudinal axis behind
the wall.
2.2
Backfill soil properties
The sand backfill is clean poorly-graded sand classifying as
SP according to the Unified Soil Classification System and A-1-
b according to the AASHTO system. The particle size
distribution curve falls within the gradation limits for washed
concrete sand (ASTM C33) with Cu of 3.7 and Cc of 0.7. A
modified Proctor test was performed on the sand and indicated a
maximum dry unit weight of 17.8 kN/m3 (113.5 lbs/ft3). The
sand was placed in 150 mm (6 in) lifts and the average relative
compaction achieved was typically about 98%.
Load testing was generally performed two days after
compaction and moisture content measurements at various
depths were made immediately after testing. These
measurements indicated good consistency between tests, with
the moisture content typically falling within 7 to 9%.
Based on a direct shear test the drained friction angle (
ϕ
’)
was found to be 46º with a cohesion of 7 kPa (140 psf).
Interface friction tests were also performed between the sand
and the concrete and a wall friction angle (
) of 33º was
measured.
Because the compacted sand in a partially saturated state
could be excavated with a vertical face and remained stable for
long periods, the potential for apparent cohesion owing to
matric suction was also investigated. Suction measurements
indicated that the sand at the moisture content during testing had
a matric suction (ψ) (negative pressure relative to atmospheric
pressure) of approximately 4 to 5 kPa (80 to 100 psf). Based on
recommendations of Likos et al (2010), this magnitude of
suction produces an apparent cohesion (ca) of approximately 4
to 5 kPa (80 to 100 psf).
3 TEST RESULTS
3.1
Passive force-deflection curves
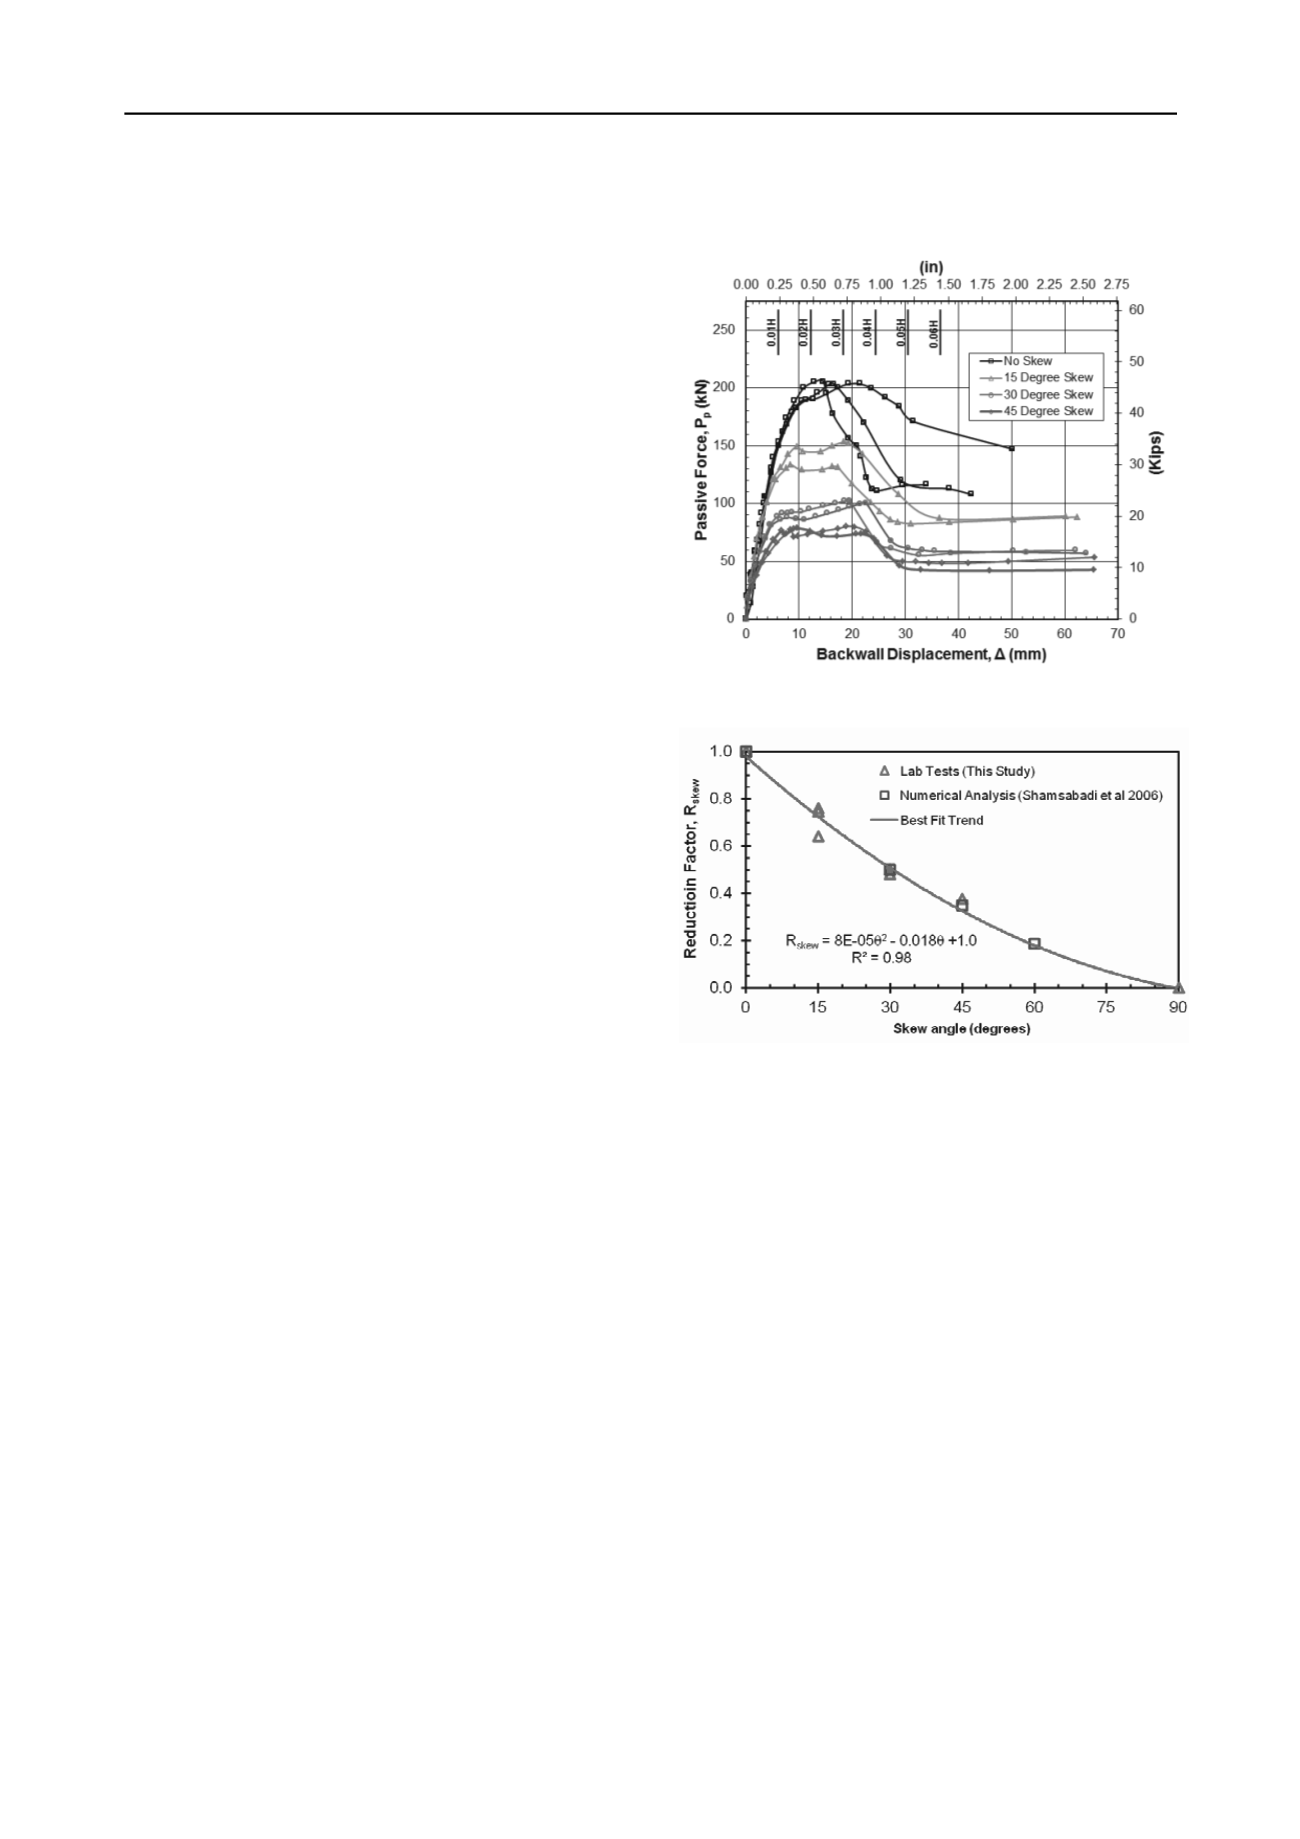
The passive force versus longitudinal deflection curves for
the tests at each of the skew angles are plotted in Fig. 3.
Although the initial stiffness for each curve is remarkably
similar, the peak passive force clearly decreases as the skew
angle increases. In addition, there appear to be some differences
in the shape of the passive force displacement curves as skew
angle increases.
The passive force-deflection curve appears to exhibit a
typical hyperbolic curve shape for the no skew case however, it
transitions to a different shape as the skew angle increases. As
the skew angle increases, the passive force exhibits a longer
plateau where the force remains relatively constant or increases
gradually with deflection before reaching a peak and abruptly
decreasing to a residual value. The peak passive force typically
developed at a normalized deflection of 2.5% to 3.5% of the
wall height (H), and did not change consistently with skew
angle. The tests typically showed a reduction in the passive
force to a residual value at a normalized displacement of 0.04H
to 0.06H. The post-peak residual strength ranged from 53 to
72% of the peak value with an average of 60%.. This decrease
in post peak resistance is consistent with results from the direct
shear tests.
The peak passive force for each test at a given skew angle has
been divided by the peak passive force at zero skew and the
results are plotted as a function of skew angle in Fig. 4.
Normalized data from numerical analyses of skew abutments
reported by Shamsabadi et al (2006) are also shown in Fig. 4
and the results follow the same trend line. The curve has been
extrapolated to zero at a skew angle of 90°. The no skew case
involves pure passive resistance and zero shear force. A skewed
wall is subject to a combination of both passive resistance and
side shear force. At the largest possible skew angle, 90°, the
forces acting on the wall transition to pure side shear force with
zero passive resistance.
Figure 3. Passive force versus longitudinal backwall displacement for
the tests at each skew angle
.
Figure 4. Normalized peak passive force versus skew angle from lab
tests and numerical model results.
As indicated previously, vertical and horizontal
displacements of the wall during the tests were minimal. Wall
displacement was less than 4.4 mm for vertical movement and
less than 2.3 mm for transverse movement for the skew angles
tested.
3.2
Failure surface geometry
The failure surface for the no skew case was approximately the
same length across the width of the sand box; however, when a
skew angle was involved, the failure surface also exhibited a
skew across the width of the sand box. The failure surface did
not manifest itself at the ground surface until after the peak
force had been reached.
The failure surface within the sand was clearly identifiable
from the offset in the red sand columns. The failure surface
geometry is shown as a function of distance behind the middle
of the wall for the various skew angles in Fig. 5. In addition,
the ground surface heave is also plotted for each test. The
average length of the failure surface behind the middle of the
wall was 2.1 m (7.0 ft) with a standard deviation of 0.3 m (1.0
ft). The length of the failure surface ranged from 1.8 to 2.6 m
(5.9 to 8.6 ft). The failure surface typically extended 75 mm to
300 mm. horizontally from the bottom of the wall then
exhibited a relatively linear trend line upward to the surface.
The angle of inclination of the trend line was between 19º and
21.5º with an average of 20°. Assuming that the angle of
inclination (α) of the straight line segment of the log-spiral
failure wedge is given by the equation:
α = 45 -
ϕ
'/2
(8)


