1541
Technical Committee 203 /
Comité technique 203
readings per cycle was specified. Axial deformation, cell
pressure, cyclic load, and sample pore water pressure were
recorded using automatic data acquisition system.
3.3.1
Data calculation
The data recorded during the test program is used to calculate
the dynamic properties of the tested soil such as Initial
Liquefaction, Cyclic Strength Ratio, Damping and Shear
Modulus. The initial liquefaction is defined as the number of
cycles required where the excess pore water pressure reached
the value just equal to the effective confining pressure and 5%
double amplitude axial strain whichever is earlier.
When the soil sample is subjected to symmetric cyclic
loading in cyclic triaxial apparatus, a hysteresis similar or its
equivalent to one loop shown in Figure 2 will be formed in the
plot of shear stress (τ) versus shear strain (γ). In general term,
two important characteristics of the hysteresis loop are its
inclination and breadth. The inclination of the slope can be
describe at any point during the loading process by the tangent
shear modulus, G
tan
. Tangent shear modulus, G
tan
varies
throughout a cyclic loading, but its average value over the entire
loop can be approximated by the secant shear modulus, G
sec
.
The material damping ratio (D) is calculated for a given
hysteresis loop using equation
D = A
L
/(4πA
T
) × 100 (1)
Where,
A
L
= area of hysteresis loop,
A
T
= area of shaded right triangle shown in Figure 2, and
D = material damping ratio, %.
Calculations are performed to compute the value of secant shear
modulus (G
sec
) and damping ratio (D) on each of the hysteresis
loop at cycle number 1, 5, 10, 20, and 40 (ASTM D 3999-91,
2003).
Figure 2. Schematic of typical hysteresis loop generated by cyclic
triaxial apparatus.
4 RESULTS AND DISCUSSION
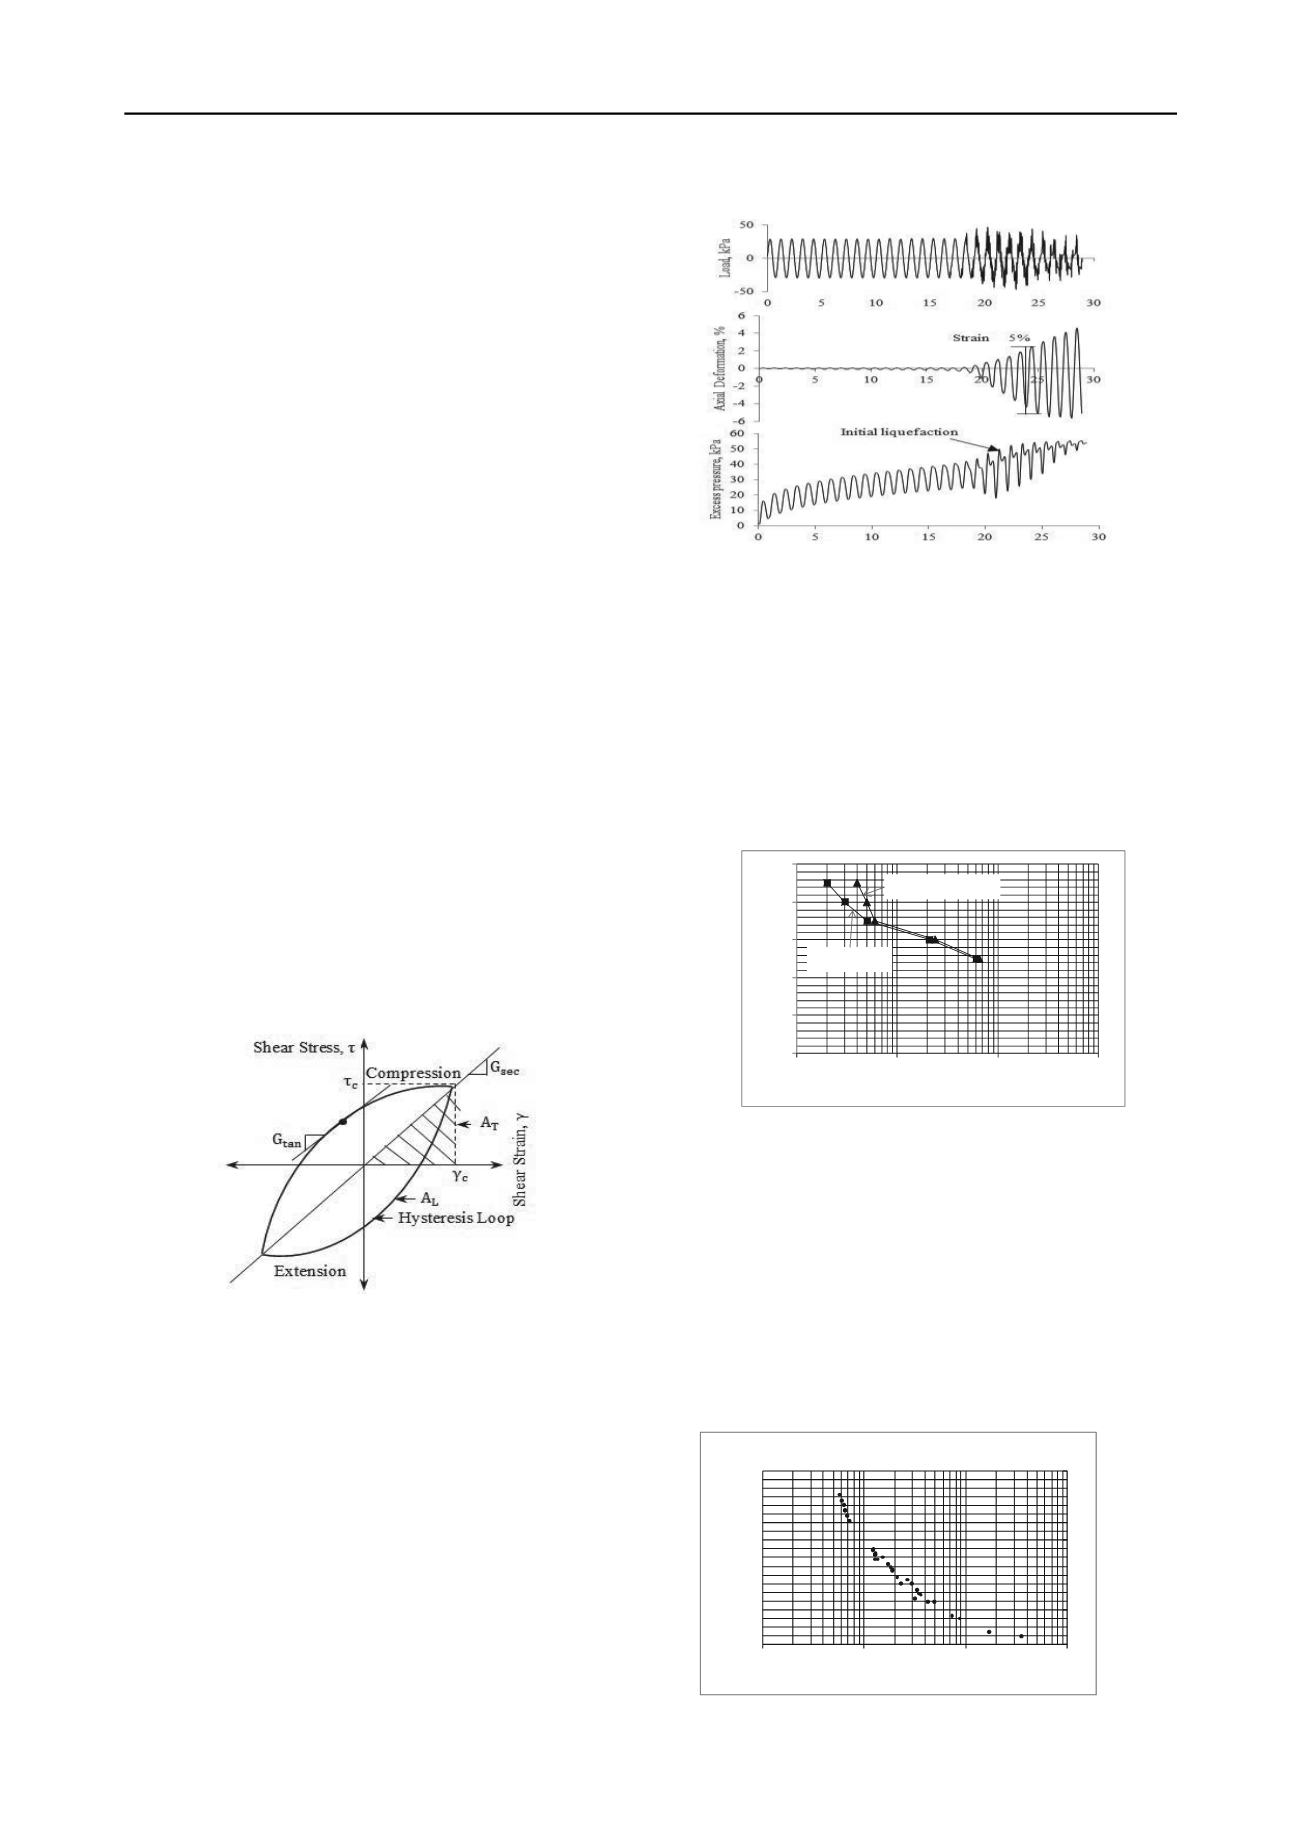
A typical time history of axial load, axial deformation and
induced excess pore water pressure obtained at cyclic stress
ratio 0.30 for Sand-01 is shown in Figure 3. From this figure it
is clear that under a constant cyclic vertical load application the
pore pressure increases gradually until cycle 21 where the
excess pore water pressure just equal to the effective confining
pressure, which is defined as initial liquefaction. In addition, it
is clear that small cyclic deformations were induced in the
specimen until approximately cycle 19, after which the cyclic
deformations built up rapidly.
Figure 3. Recorded load, deformation and pore water pressure time
history for cyclic stress ratio 0.30.
The relationship between the cyclic stress ratio and the
number of cycles needed for liquefaction of Sand-01 are shown
in Figure 4. From this figure it is clear that for any definition of
failure, the number of cycle required to failure decreases with
increasing cyclic stress ratio. Initial liquefaction occurred before
the 5% DA axial strain in all tests. The cyclic strength of the
soil is specified in terms of magnitude of cyclic stress ratio
(CSR) required reaching 5% double amplitude axial strain in 20
cycles of uniform load application, and the cyclic strength ratio
of the sand is 0.315.
0
0.1
0.2
0.3
0.4
0.5
1
10
100
1000
Cyclic Stress Ratio
Number of Cycle
5%DA strain
Initial Liquefaction
Figure 4. Variation of cyclic stress ratio with the number of cycles
for Sand-01.
The variation of shear modulus and damping as a function of
shear strain are shown in Figure 5 and Figure 6. Reduction in
shear modulus and increase in damping with increasing shear
strain was observed. The soil, which is initially stiff, loses its
stiffness due to increase in pore water pressure as number of the
loading cycle increases. The progression of loading cycles
induces higher magnitudes of pore water pressures resulting
reduction of shear modulus. It is necessary to perform more
tests at different relative densities and confining pressure to see
their effect on shear modulus and damping of local sandy soil.
These test results would help to evaluate site response analysis.
0
0.2
0.4
0.6
0.8
1
0.001
0.01
0.1
1
Gsec/Gmax
Shear Strain, %
Shear Modulus Reduction Curve
Figure 5. Variation of shear modulus with shear strain for Sand-01.


