1545
Technical Committee 203 /
Comité technique 203
shallow embedment depth, the horizontal displacement comes
through a remarkable increase from the maximum acceleration
moment (30s after the occurrence of the earthquake), and the
steel fabricated column finally topples. On the other hand, in
Case1 with the deep embedment depth, although it oscillates
right and left about 30cm at the maximum, stability is
maintained during the earthquake. And the residual
displacement is as small as 15cm (1.0% of inclination). As
mentioned above, the subsurface layer has lost its bearing
capacity due to liquefaction. If the embedment depth is shallow
like Case2 of which the center-of-gravity position is high,
structure will incline easily and gradually tilt under its own
weight. On the other hand, if the embedment depth of a
structure is deep like Case1, a load assignment has reached even
deeper to prevent eccentric failure and maintain stability.
Moreover, the structure has sunk about 10cm during the
earthquake. If the column kept stable without large horizontal
displacement during the earthquake, in addition to the fall effect
of the center-of-gravity position accompanying with the
settlement during the earthquake, the recovery of ground
rigidity after the earthquake will also contribute to an increase
in the subsequent stability of the structure.
10
- 1
10
0
10
1
10
2
10
- 1
10
0
10
1
10
2
0
1
2
10
- 1
10
0
10
1
10
2
Mean effective stress
p
(kPa)
Shear strain
s
(%)
Deviator stress
q
(kPa)
Deviator stress
q
(kPa)
Reclaimed sand
Reclaimed sand
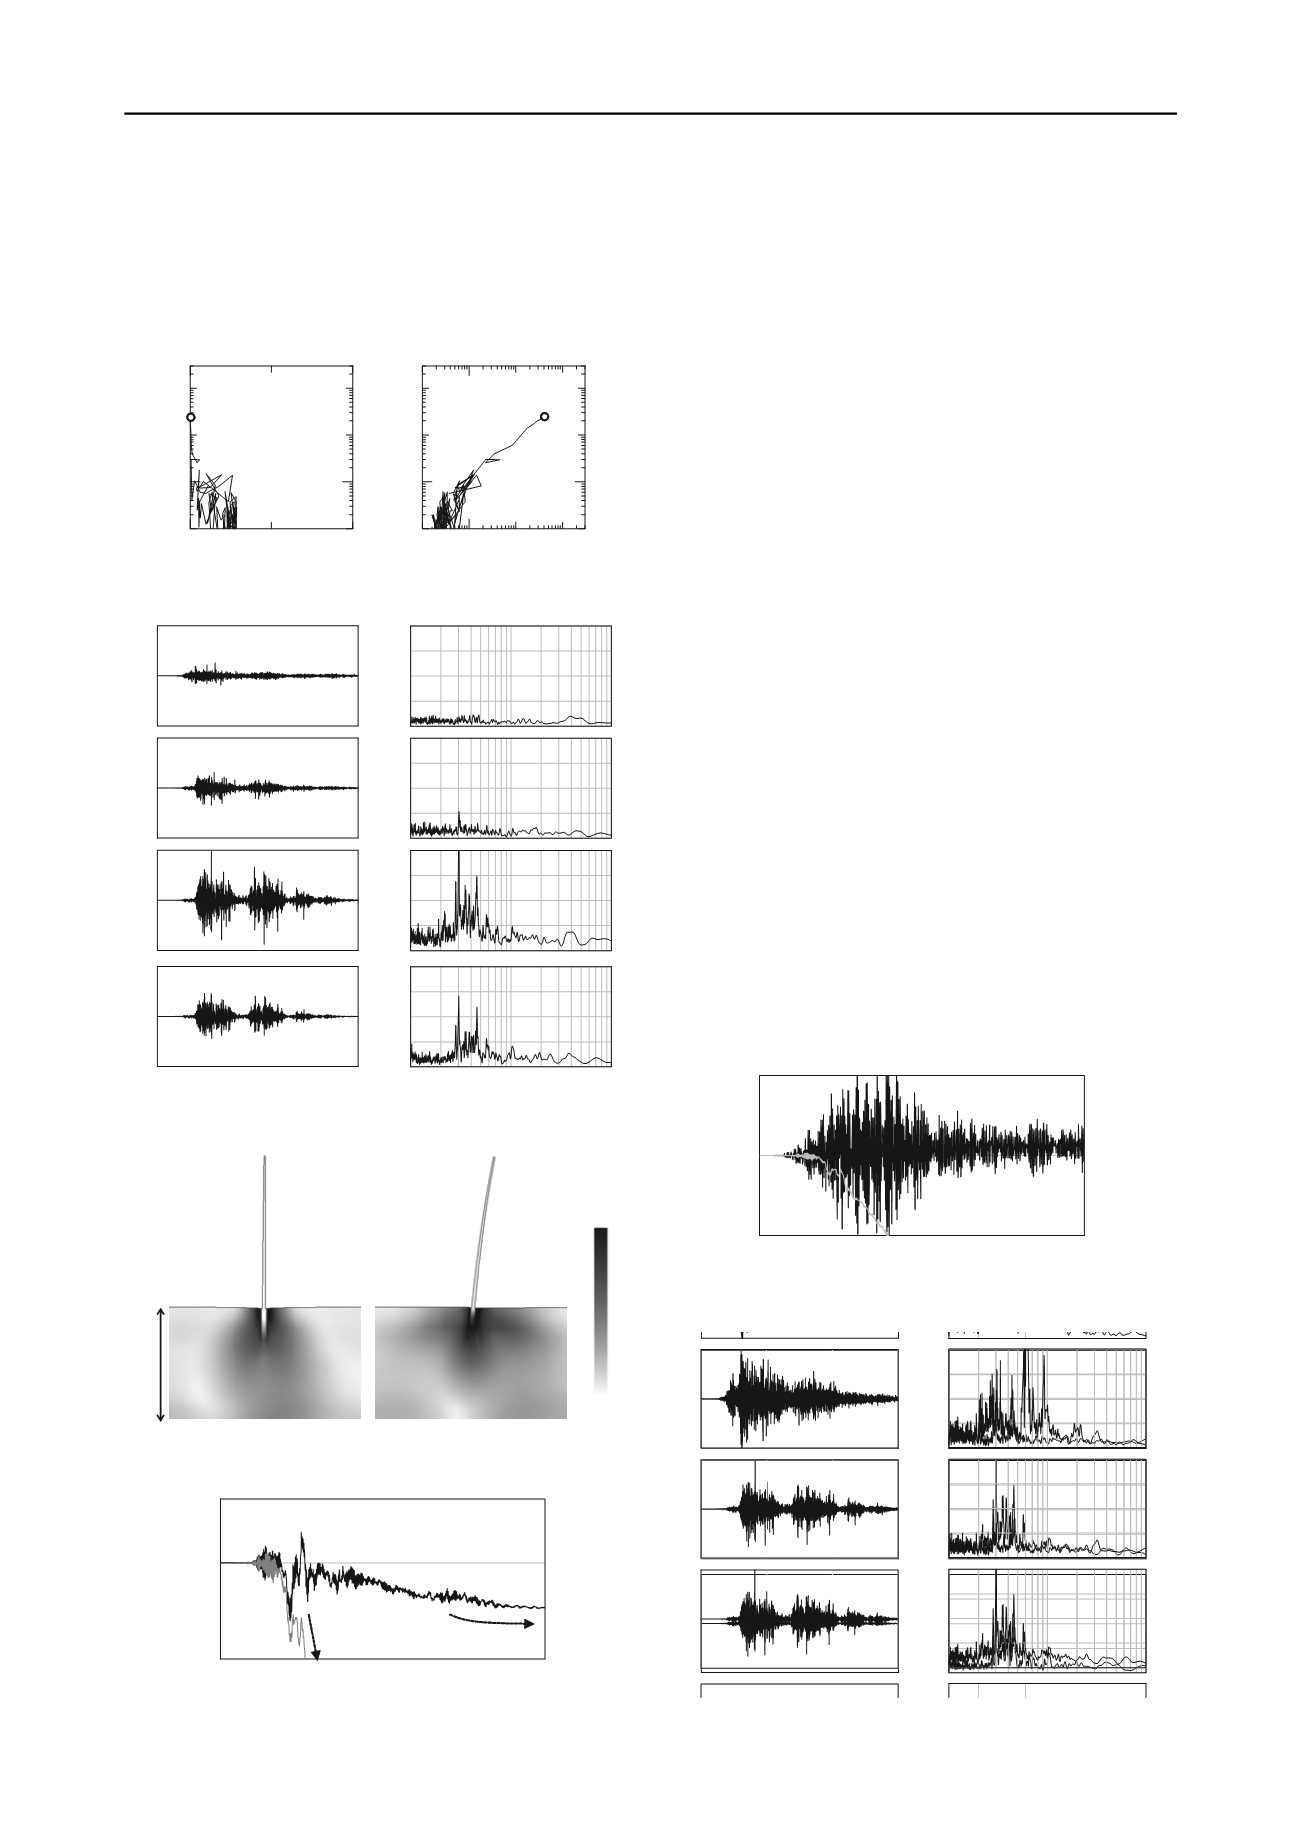
Figure 5.
Element behavior of reclaimed sand in the center of layer
10
−1
10
0
10
1
0
100
200
300
400
0
100
200
300
400
0
100
200
300
400
0
100
200
300
400
Period (s)
3.2
Influence of the soil properties of the surface layer
Fig. 9 shows a comparison of the deformation (horizontal
displacements and vertical settlements) at the tips of the
column. As described above, even if the degree of oscillation at
the ground surface is small when the surface layer is sand at
Case2, the steel fabricated column tilts under its own weight
since the bearing capacity of the ground is declining by
liquefaction. On the other hand, when the surface layer is clay,
it can be seen that although the maximum horizontal
displacement of the tip of the column is over 100cm, ultimately,
there is almost no residual displacement and kept stable during
and after the earthquake. Moreover, compared with a sandy
ground in Case2, there is nearly no settlement in the clayey
ground during the earthquake.
Fourieramplitude (gal*s)
Fourieramplitude (gal*s) Fourieramplitude (gal*s) Fourieramplitude (gal*s)
Fig. 10 depicts the acceleration response and the Fourier
amplitude spectrum at each layer boundary. For subsurface clay
soil, decrease in effective stress and generation of shear strain is
much smaller compared with subsurface sandy soil in ground
Type A shown in Fig. 6. Therefore, acceleration is greatly
amplified in the alluvial clay layer. Consequently, ground
oscillates right and left significantly by the amplification of
acceleration when a subsurface layer is clayey soil, but the
0
50
100
150
−800
0
800
−800
0
800
−800
0
800
−800
0
800
Time (s)
Acceleration (gal)
Acceleration (gal)
Acceleration (gal)
Acceleration (gal)
Ground surface
Boundary between
As & Fs
Boundary between
Ds & As
Boundary between
M & Ds
Ground surface
Boundary between
As & Fs
Boundary between
Ds & As
Boundary between
M & Ds
Figure 6. Acceleration response and the Fourier amplitude spectrum at
each layer boundary for ground Type A
LS
0%
3%
Case1
Case2
Figure 7.
Shear strain distributions 2min
after the earthquake
0
50
100
150
20
0
- 20
Time (s)
Horizontal displacement (cm)
Case1
Case2
converge
toppling
Figure 8.
Comparison of the deformation at the tips of the column for
Case1, 2 and 3
0
50
100
150
100
50
0
- 50
- 100
Time (s)
Horizontal displacement (cm)
Case3
Case2
Figure 9.
Comparison of the deformation at the tips of the column for
Case2 and Case3
10
-1
10
0
10
1
0
100
200
300
400
0
100
200
300
400
0
100
200
300
400
0
Period (s)
Fourieramplitude (gal*s)
Fourieramplitude (gal*s) Fourieramplitude (gal*s) Fo
400
0
100
200
300
400
00
300
l*s)
Fourieramplitude (gal*s)
a litude a * )
a itude a )
0
50
100
150
-800
0
800
-800
0
800
-800
0
800
-800
Time (s)
Acceleration (gal)
Acceleration (gal)
Acceleration (gal)
800
-800
0
800
A celeration (gal)
tion g l
tion g l
Ground surface
Boundary between
Ds & Ac
Boundary between
M & Ds
Ground surface
Boundary between
Ds & Ac
Boundary between
M & Ds
Figure 10. Acceleration response and the Fourier amplitude spectrum at
each layer boundary for ground Type B


