1537
Technical Committee 203 /
Comité technique 203
larger grain sizes and the maximum shear strain reached in the
RCTS tests were less than 0.5%, the effect of the drainage
condition was not expected to be significant on the measured
dynamic properties.
For each gravel specimen, RCTS testing was performed at
five effective isotropic confining pressures (
0
’) (i.e., 52, 207,
414, and 827 kPa). At each
0
’, the specimen was first subjected
to “consolidation” period up to 100 minutes. After 100 minutes,
the TS tests and/or the RC tests were performed. If the TS test
was performed, it was performed before the RC test, because
the maximum strain amplitude reached in the TS test is
generally lower than that in the RC test, leading to less potential
disturbance in specimen.
During the TS test, hysteresis loops were generated from the
measured torque and displacement at the top of the specimen.
The slope of the line connecting the end points of the hysteresis
loop is the secant shear modulus, G, representing the average
shear stiffness of the soil at the peak strain in the test. Only TS
test results at a loading frequency of 0.5 Hz and measured for
the 10th cycle are presented here, as it best represents typical
seismic loading (Zhang et al. 2005).
From the RC tests, a frequency response curve was obtained
that shows the accelerometer output versus excitation
frequency. The V
s
is derived from the resonant frequency, with
consideration of the specimen geometry and equipment
characteristics. The shear modulus is then calculated using G =
V
s
2
, where
is the mass density of the material.
For both the RC and TS tests, the variation of G as a function
of increasing
is determined by increasing the driving force in
steps. The resulting G/G
max
~ log(
curves can be derived,
taking as G
max
the G value measured at the lowest strain level
(about 10
-4
%).
For the two PA specimens (i.e., PA-1-A and PA-1-B), the
membranes around the specimens were punctured by the test
material when the confining pressure was increased to 414 kPa,
and thus no further test was carried out.
5 NORMALIZED SHEAR MODULUS OF COMPACTED
GRAVEL
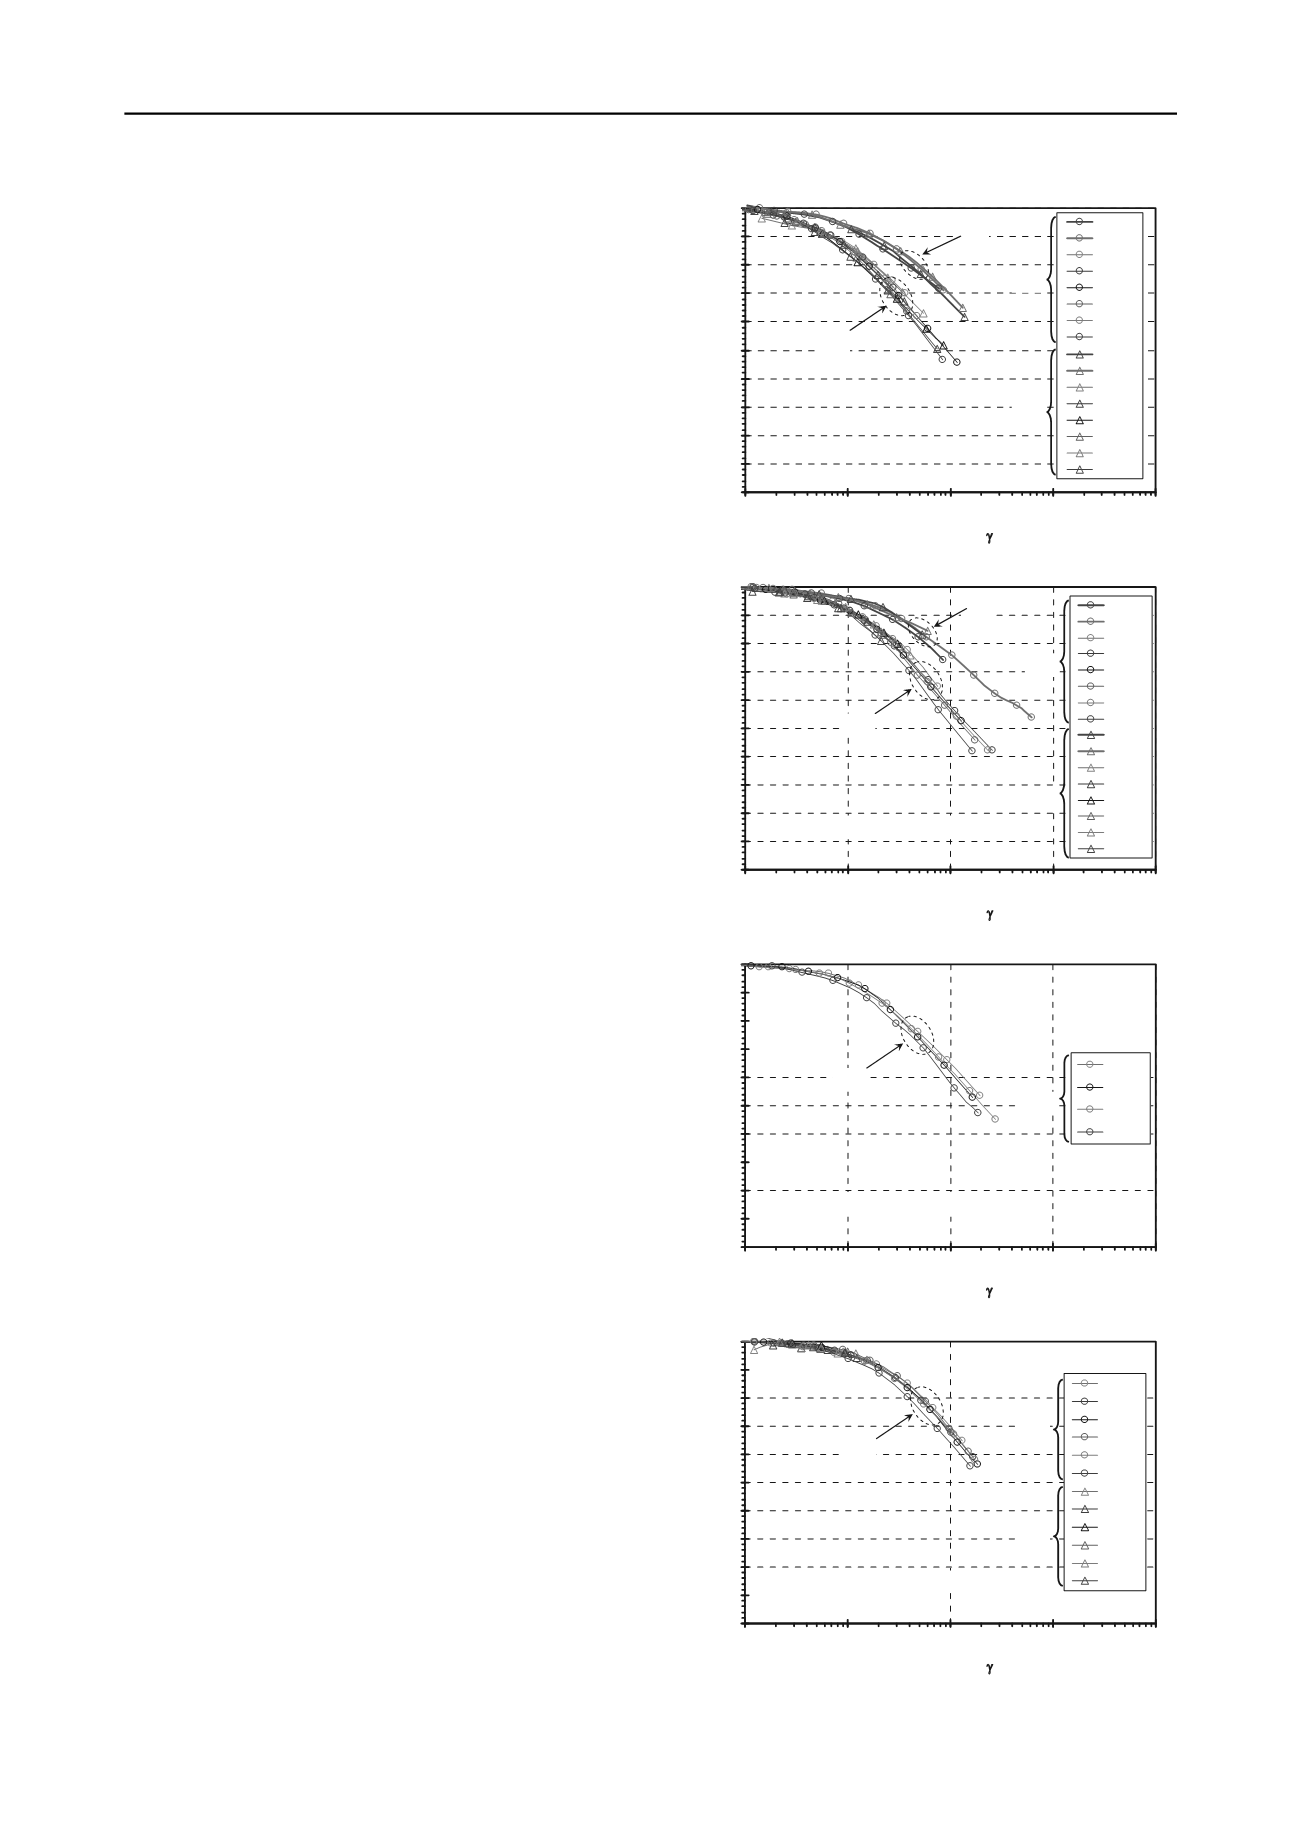
In Figures 3, the measured G/G
max
~ log(
curves for the
specimens under the different confining pressures are presented.
The circular and triangular symbols represent the measured data
points from RC and TS tests, respectively, and the thin lines and
thick lines connect data points of the WA specimens and PA
specimens, respectively. The value of G/G
max
decreases with the
increasing
above a threshold strain (
t
) for all gravel
specimens. This behavior is consistent with the observation of
most researchers, except for Lin et al. (2000) who noticed that
when shear strain surpassed 0.1%, the measured shear moduli of
specimens with 60% and 80% of gravel content increase with
increasing shear strain, and indicated this different behavior
might be attributed to the effect of gap-graded grain size
distribution. The values of
t
range from about 0.00015% to
0.0005% for the WA specimens, and are slightly larger for the
PA material, showing an increase as
0
’ increases, similar to
Menq (2003)’s observation.
As noted above, the PA gravels behave more linearly than
the WA material, which is consistent with Menq (2003)’s
conclusion that the value of G/G
max
decreases as C
u
increases.
This difference is sometimes attributed to gravel content as
observed by Rollins et al. (1998). It is interesting to note that for
either gravel type (i.e., PA or WA), no consistent difference was
found by grouping them by test type (RC or TS), which
confirms that the G/G
max
~ log(
curves are not sensitive to
loading frequency (Darendeli, 2001). The density (95% and
100% compaction for the WA samples, and 80% and 100%
relative density for the PA samples) was not found to have a
0.0
0.1
0.2
0.3
0.4
0.5
0.6
0.7
0.8
0.9
1.0
0.0001
0.001
0.01
0.1
1
Shearing Strain,
(%)
Normalized Shear Modulus, G/G
max
PA-1-A
PA-1-B
WA-1-A
WA-1-B
WA-2-A
WA-2-B
WA-3-A
WA-3-B
PA-1-A
PA-1-B
WA-1-A
WA-1-B
WA-2-A
WA-2-B
WA-3-A
WA-3-B
Confining Pressure = 52 kPa
RC
TS
WA
PA
(a) Isotropic Confining Pressure = 52 kPa
0.0
0.1
0.2
0.3
0.4
0.5
0.6
0.7
0.8
0.9
1.0
0.0001
0.001
0.01
0.1
1
Shearing Strain,
(%)
Normalized Shear Modulus, G/G
max
PA-1-A
PA-1-B
WA-1-A
WA-1-B
WA-2-A
WA-2-B
WA-3-A
WA-3-B
PA-1-A
PA-1-B
WA-1-A
WA-1-B
WA-2-A
WA-2-B
WA-3-A
WA-3-B
Confining Pressure = 207 kPa
RC
TS
WA
PA
(b) Isotropic Confining Pressure = 207 kPa
0.0
0.1
0.2
0.3
0.4
0.5
0.6
0.7
0.8
0.9
1.0
0.0001
0.001
0.01
0.1
1
Shearing Strain,
(%)
Normalized Shear Modulus, G/G
max
WA-1-A
WA-2-A
WA-3-A
WA-3-B
Confining Pressure = 414 kPa
RC
WA
(c) Isotropic Confining Pressure = 414 kPa
0.0
0.1
0.2
0.3
0.4
0.5
0.6
0.7
0.8
0.9
1.0
0.0001
0.001
0.01
0.1
1
Shearing Strain,
(%)
Normalized Shear Modulus, G/G
max
WA-1-A
WA-1-B
WA-2-A
WA-2-B
WA-3-A
WA-3-B
WA-1-A
WA-1-B
WA-2-A
WA-2-B
WA-3-A
WA-3-B
Confining Pressure = 827 kPa
RC
TS
WA
(d) Isotropic Confining Pressure = 827 kPa
Figure 3. G/G
max
~
curves for the specimens subject to RCTS tests.


