1540
Proceedings of the 18
th
International Conference on Soil Mechanics and Geotechnical Engineering, Paris 2013
for values of fines content greater than 44 % (Xenaki and
Athanasopoulos, 2003). Cyclic strength of silty sands with 15%
fines has only one-half of the resistance to liquefaction of clean
sands at the same effective confining pressure (Troncoso, 1986).
Addition of nonplastic silt with clean sand results in increasing
pore pressure up to a limiting value that corresponds to 30% in
silt content. Further, addition of low plasticity silt to sand has no
significant effect on the generated pore pressures, up to 60% in
silt content (Erten and Maher, 1995). Liquefaction of soils
occurred with upto 70% fines and 10% clay fraction during
Mino-Owar, Tohankai and Fukui earthquakes (Kishida, 1969).
Cyclic tests on Ottawa sands showed that, for a constant dry
density, the liquefaction resistance decreased as fines were
added to sand (Shen et al, 1977). At a constant relative density,
additional fines (10% to 50%) acted to increase the liquefaction
resistance of sand (Amini and Qi, 2000). Liquefaction of silty
soils found that increased plasticity results in an increased
cyclic strength and silty soils, having a plasticity index of 15 or
more the state of initial liquefaction never developed. It has
been demonstrated that the fine grained tailings that were
identified as being nonplastic exhibited much smaller cyclic
strength than the tailings having a plasticity index of 15-20
(Ishihara et al, 1980). Specimens tested using a fast rise time
square wave form, shows strength value about 15% less than
those tested using a sine wave loading.
Cyclic strength of the specimens prepared using the dry
method is on the order of half the strength of the specimens
prepared using the wet method (Marshall et al, 1976). The effect
of relative density on shear modulus of dry and saturated sands
is significant in the small strain levels (0.1% to 0.5%) and
thereafter the effect of relative density on shear modulus with
increase in shear strain is not significant. The damping ratios of
dry and saturated sands increase with increase in shear strain
and the effect of relative density on damping is not very
significant in both cases. There is a reduction in shear modulus
and an increase in damping at large shear strain levels
(Kokusho, 1980; Dinesh, 2004). Relative density has no
significant influence on the dynamic properties of soils in the
large strain (greater than 1%) levels, but it has considerable
influence at small strain levels (Sitharam et al, 2004ab).
This paper summarized the liquefaction potential and
dynamic properties of a local sandy soil at constant relative
density and constant effective confining pressure. Effect of
nonplastic silt on cyclic shear strength of fine sand is also
present in this paper.
3 EXPERIMENTAL INVESTIGATIONS
3.1
Soil sampling and characterization
A fine sand (hereinafter called Sand-01) sample was collected
from the site close to Piyain river of Jaflong, Sylhet,
Bangladesh. Table 1 gives the summary of index properties of
the sand sample collected and used for testing. It is clear from
the index properties that the soils contain a large percentage of
fine sand with appreciable amount of fines that are more prone
to liquefaction. A fine sand (Hereinafter called Sand-02) and a
nonplastic silt was collected from Mawa Padma Bridge site.
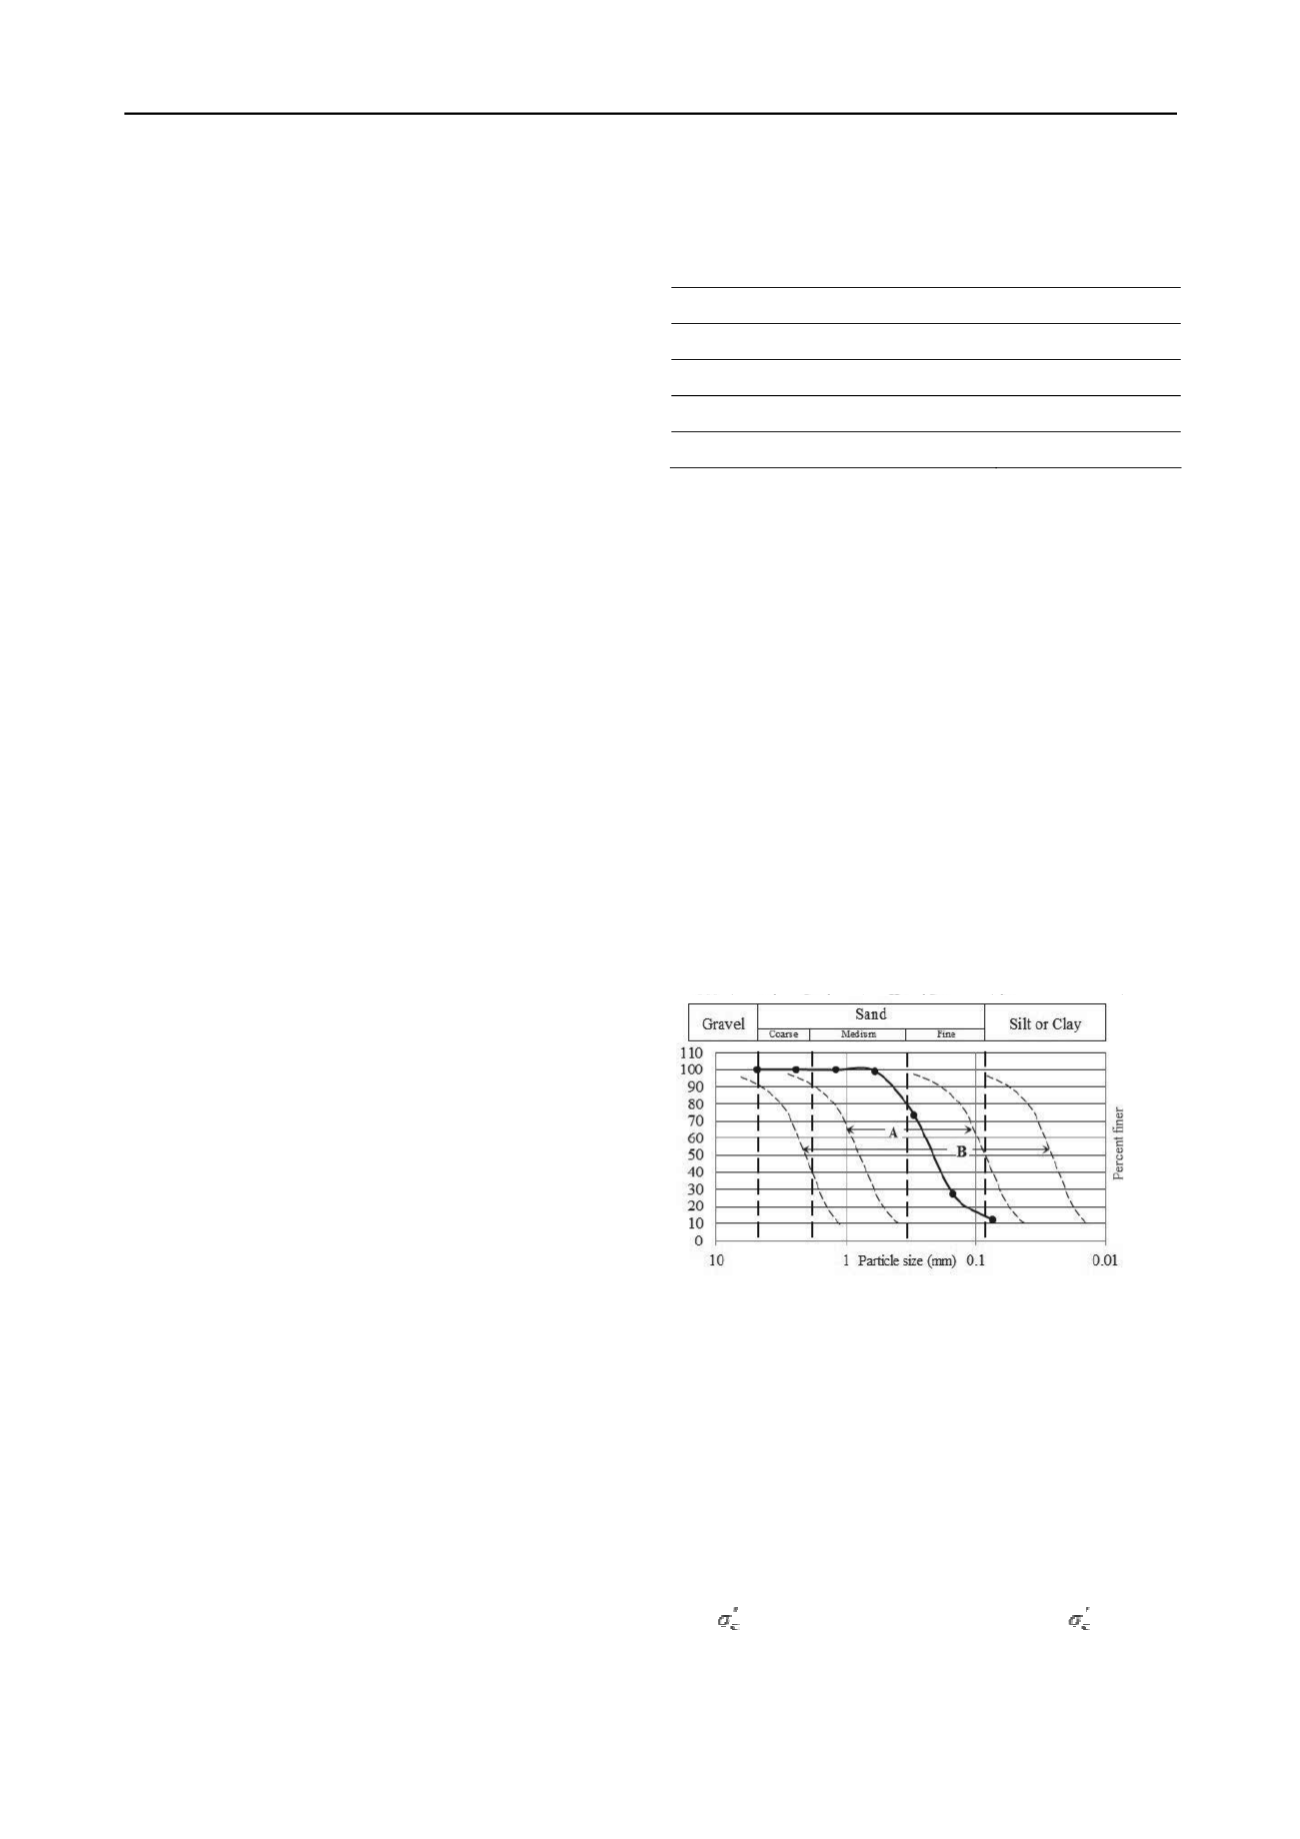
Figure 1 shows the grain size distribution of the Sand-01 as well
as limits in the gradation curves separating liquefiable and non-
liquefiable soils (Tsuchida, 1970). Fineness modulus and D
50
of
Sand-02 is 0.92 and 0.20 mm respectively. Sand-02 is finer than
Sand-01 (FM=1.01).
3.2
Sample preparation
Soil specimens of size 71 mm diameter and 143 mm in height
were prepared using wet tamping technique. The sand was
initially mixed in a container with 8% to 10% moisture. Then
the wet sand was poured into the mold in 5 layers and
compacted in 5 layers using 35.5 mm diameter circular
aluminum tamper, weighing about 800 g at a relative density of
55%.
Table 1. Index properties of sand sample used for cyclic triaxial test.
Index Properties
Value
Specific Gravity
2.65
Fineness Modulus
1.01
Coarse, Medium, Fine sand and Silt %
0.2, 9.8, 78.3 and 11.7
Maximum and Minimum Density
16.7 and 12.15 kN/m
3
The soil specimen was sealed in a water tight rubber
membrane with O-ring and confined in a triaxial chamber where
it was subjected to a confining pressure of 20 kPa. In order to
improve the initial saturation of the specimen, carbon dioxide
(CO
2
) was allowed to flow through the specimen at a low
pressure (less than 20 kPa) in order to replace the air in the
specimen pores. After 30 minutes, the flow of carbon dioxide
(CO
2
) was stopped and a tank of de-aired water was attached to
the drainage line on the bottom platen. The de-aired water was
then allowed to flow upward through the specimen in order to
saturate the specimen. Once the desired volume of de-aired
water had flowed through the specimen, the drainage valves on
the cell were again closed and the de-aired water line removed.
The specimens were then saturated with de-aired water using
backpressure saturation. The back pressure was increased
gradually while maintaining the effective confining pressure at
10 kPa. This process was continued until the Pore Pressure
Parameter B (B = Δu/Δσ
c
, where, Δu = Change in specimen
pore pressure and Δσ
c
= Change in confining pressure)
exceeded 0.95. Following saturation, the sand specimen was
isotropically consolidated to an effective stress of 50 kPa.
Figure 1. Grain size distribution curve and limits in the gradation curves
(A- Boundaries for most liquefiable soil, B-Boundaries for Potentially
liquefiable soil) separating liquefiable and non-liquefiable soils.
3.3
Cyclic loading and data acquisition
Before the application of cyclic load an air pocket at the top of
the triaxial chamber was formed by draining water from the cell
without allowing the cell pressure to drop. Then cyclic loading
was applied on the soil specimens using the stress-controlled
method. The cyclic triaxial strength tests were conducted under
undrained conditions to simulate essentially undrained field
conditions during an earthquake or dynamic loading. The tests
were conducted at a constant Cyclic Stress Ratio (CSR =
(σ
dc
/2 , where (σ
dc
= cyclic deviator stress and
= effective
confining pressure). CSR was varied from 0.15 to 0.45 at the
interval of 0.05. In the entire test program, a harmonic loading
was applied using sine wave with a frequency of 1 Hz, the
maximum peak-peak axial strain 10%, the number of cycles
limited to 100 cycles and a recording speed of 50 numbers of
for values of fines content greater than 44 % (Xenaki and
Athanasopoulos, 2003). Cyclic strength of silty sands with 15%
fines has only one-half of the resistance to liquefaction of clean
sands at the same effective confining pressure (Troncoso, 1986).
Addition of nonplastic silt with clean sand results in increasing
pore pressure up to a limiting value that corresponds to 30% in
silt content. Further, addition of low plasticity silt to sand has no
significant effect on the generated pore pressures, up to 60% in
silt content (Erten and Maher, 1995). Liquefaction of soils
occurred with upto 70% fines and 10% clay fraction during
Mino-Owar, Tohankai and Fukui earthquakes (Kishida, 1969).
Cyclic tests on Ottawa sands showed that, for a constant dry
density, the liquefaction resistance decreased as fines were
added to sand (Shen et al, 1977). At a constant relative density,
additional fines (10% to 50%) acted to increase the liquefaction
resistance of sand (Amini and Qi, 2000). Liquefaction of silty
soils found that increased plasticity results in an increased
cyclic strength and silty soils, having a plasticity index of 15 or
more the state of initial liquefaction never developed. It has
been demonstrated that the fine grained tailings that were
identified as being nonplastic exhibited much smaller cyclic
strength than the tailings having a plasticity index of 15-20
(Ishihara et al, 1980). Specimens tested using a fast rise time
square wave form, shows strength value about 15% less than
those tested using a sine wave loading.
Cyclic strength of the specimens prepared using the dry
method is on the order of half the strength of the specimens
prepared using the wet method (Marshall et al, 1976). The effect
of relative density on shear modulus of dry and saturated sands
is significant in the small strain levels (0.1% to 0.5%) and
thereafter the effect of relative density on shear modulus with
increase in shear strain is not significant. The damping ratios of
dry and saturated sands increase with increase in shear strain
and the effect of relative density on damping is not very
significant in both cases. There is a reduction in shear modulus
and an increase in damping at large shear strain levels
(Kokusho, 1980; Dinesh, 2004). Relative density has no
significant influence on the dynamic properties of soils in the
large strain (greater than 1%) levels, but it has considerable
influence at small strain levels (Sitharam et al, 2004ab).
This paper summarized the liquefaction potential and
dynamic properties of a local sandy soil at constant relative
density and constant effective confining pressure. Effect of
nonplastic silt on cyclic shear strength of fine sand is also
present in this paper.
3 EXPERIMENTAL INVESTIGATIONS
3.1
Soil sampling and charact rization
A fine sand (hereinafter called Sand-01) sample was collected
from the site close to Piyain river of Jaflong, Sylhet,
Bangladesh. Table 1 gives the summary of index properties of
the sand sample collected and used for testing. It is clear from
the index properties that the soils contain a large percentage of
fine sand with appreciable amount of fines that are more prone
to liquefaction. A fine sand (Hereinafter called Sand-02) and a
nonplastic silt was collected from Mawa Padma Bridge site.
Figure 1 shows the grain size distribution of the Sand-01 as well
as limits in the gradation curves separating liquefiable and non-
liquefiable soils (Tsuchida, 1970). Fineness modulus and D
50
of
Sand-02 is 0.92 and 0.20 mm respectively. Sand-02 is finer than
Sand-01 (FM=1.01).
3.2
Sample prepar ti
Soil specimens of size 71 mm diameter and 143 mm in height
were prepared using wet tamping technique. The sand was
initially mixed in a container with 8% to 10% moisture. Then
the wet sand was poured into the mold in 5 layers and
compacted in 5 layers using 35.5 mm diameter circular
aluminum tamper, weighing about 800 g at a relative density of
55%.
Table 1. Index properties of sand sample used for cyclic triaxial test.
Index Properties
Value
Specific Gravity
2.65
Fineness Modulus
1.01
Coarse, Medium, Fine sand and Silt %
0.2, 9.8, 78.3 and 11.7
Maximum and Minimum Density
16.7 and 12.15 kN/m
3
The soil specimen was sealed in a water tight rubber
membrane with O-ring and confined in a triaxial chamber where
it was subjected to a confining pressure of 20 kPa. In order to
improve the initial saturation of the specimen, carbon dioxide
(CO
2
) was allowed to flow through the specimen at a low
pressure (less than 20 kPa) in order to replace the air in the
specimen pores. After 30 minutes, the flow of carbon dioxide
(CO
2
) was stopped and a tank of de-aired water was attached to
the drainage line on the bottom platen. The de-aired water was
then allowed to flow upward through the specimen in order to
saturate the specimen. Once the desired volume of de-aired
water had flowed through the specimen, the drainage valves on
the cell were again closed and the de-aired water line removed.
The specimens were then saturated with de-aired water using
backpressure saturation. The back pressure was increased
gradually while maintaining the effective confining pressure at
10 kPa. This process was continued until the Pore Pressure
Parameter B (B = Δu/Δσ
c
, where, Δu = Change in specimen
pore pressure and Δσ
c
= Change in confining pressure)
exceeded 0.95. Following saturation, the sand specimen was
isotropica ly con olid ted to an eff ctive stress o 50 kPa.
Figure 1. Grain size distribution curve and limits in the gradation curves
(A- Boundaries for most liquefiable soil, B-Boundaries for Potentially
liquefiable soil) sep rating liquefiable and non-liquefiable soils.
3.3
Cyclic loading and data acquisition
Before the application of cyclic load an air pocket at the top of
the triaxial chamber was formed by draining water from the cell
without allowing the cell pressure to drop. Then cyclic loading
was applied on the soil specimens using the stress-controlled
method. The cyclic triaxial strength tests were conducted under
undrained conditions to simulate essentially undrained field
conditions during an earthquake or dynamic loading. The tests
were conducted at a constant Cyclic Stress Ratio (CSR =
(σ
dc
/2 , where (σ
dc
= cyclic deviator stress and
= effective
confining pressure). CSR was varied from 0.15 to 0.45 at the
interval of 0.05. In the entire test program, a harmonic loading
was applied using sine wave with a frequency of 1 Hz, the
maximum peak-peak axial strain 10%, the number of cycles
limited to 100 cycles and a recording speed of 50 numbers of
pore pressure up to a limiting value that corresponds to 30% in
silt content. Further, addition of low plasticity silt to sand has no
significant effect on the generated pore pressures, up to 60% in
silt content (Erten and Maher, 1995). Liquefaction of soils
occurred with upto 70% fines and 10% clay fraction during
Mino-Owar, Tohankai and Fukui earthquakes (Kishida, 1969).
Cyclic tests on Ottawa sands showed that, for a constant dry
density, the liquefaction resistance decreased as fines were
added to sand (Shen et al, 1977). At a constant relative density,
additional fines (10% to 50%) acted to increase the liquefaction
resistance of sand (Amini and Qi, 2000). Liquefaction of silty
soils found that increased plasticity results in an increased
cyclic trength and silty soils, having plasticity index of 15 or
more the state of initial liquefaction never developed. It has
been demonstrated tha the fine grained tailings that were
i entified s b ing nonplast c exhibited much smaller cyclic
strength tha the tail ngs aving a plasticity i dex of 15-20
(Ishihara t al, 1980). Specimens tested using a fast rise time
squar wave fo m, shows strength value about 15% les than
those tested using a sin wave loading.
Cyclic st ength of the specimens prepared using the dry
method is on the order of half the strength of he spec mens
prepared using the wet method (Marshall et al, 1976). The effect
of relative densi y on hear modulus of dry and satur ted sands
i significant in the small strain levels (0.1% to 0.5%) and
thereafter the effec of relative density on sh ar mo ulu with
increase i shear strain is not significant. The damping ra s of
dry and saturated sands i crease with increase in shear s rain
and the effect of relative density on damping is not very
significant in both cases. There is a reduction in shear modulus
and an increase in damping at large shear strain levels
(Kokusho, 1980; Dinesh, 2004). R lative density has no
sign ficant influence on the dynamic properties of soils in the
lar e str in (gre ter than 1%) leve s, bu it has c nsiderable
influence t small strain levels (Sitharam et al, 2004ab).
This paper summarized
e iquefaction pot ntial and
dynamic properties of loc l sandy soil at constant relative
density and constan ffective confining pres ure. Effect of
nonpla tic silt on cyclic shear strength of fin and is also
pres nt in this pap r.
3 EXPERIMENTAL INVESTIGATIONS
3.1
Soil sampling and characterization
A f ne sand (hereinafter called Sand-01) sample was collected
from he site close to Piyain river of Jaflong, Sylhet,
Bangladesh. T ble 1 gives the summary of index properties of
the sand s mple collected and used for tes ng. It is cle r from
the index properties that the soils contain a large percentage of
fi e sand with appreciabl amount of f nes that ar more prone
t liquefaction. A fine sand (Hereinafter called Sand-02) and a
nonplastic silt was collected from Mawa Padma Bridge site.
Figure 1 shows the grain size distribution of the Sand-01 as well
as limits in the gradation curves separating liquefiable and non-
liquefiable soils ( suchida, 1970). Fineness modulus and D
50
of
Sand-02 is 0.92 and 0.20 mm respectively. Sand-02 is finer than
Sand-01 (FM=1.01).
3.2
Sample preparation
Soil speci ens of size 71 mm di eter and 143 mm in height
were prepared using wet tamping technique. The sand was
initially mixed in a container with 8% to 10% moisture. Then
the wet sand was poured into the mold in 5 layers and
compacted in 5 layers using 35.5 mm diameter circular
Index Properties
Value
Specific Gravity
2.65
Fineness Modulus
1.01
Coarse, Medium, Fine sand and Silt %
0.2, 9.8, 78.3 and 11.7
Maximum and Minimum Density
16.7 and 12.15 kN/m
3
The soil specimen was sealed in a water tight rubber
membrane with O-ring and confined in a triaxial chamber where
it was subjected to a confining pressure of 20 kPa. In order to
improve the initial saturation of the specimen, carbon dioxide
(CO
2
) was allowed to flow through the specimen at a low
pressure (less than 20 kPa) in order to replace the air in the
specimen pores. After 30 minutes, the flow of carbon dioxide
(CO
2
) was stopped and a tank of de-aired water was attach d to
the drainage line on the bottom platen. The de-aired water was
then allowed to flow upward through the specimen in order to
saturate the specimen. Onc the desired volume of de-aired
water had flowed through the specimen, the drainage valves on
the cell were again close
the de-aired water line removed.
The specimens were then saturated with de-aired water using
backpressure saturation. The back pressure was increased
gradually while maintaining the effective confining pressure at
10 kPa. This process was continued until the Pore Pressure
Parameter B (B = Δu/Δσ
c
, wh re, Δu = Change in specimen
pore pressure and Δσ
c
= Change in confining pressure)
exceeded 0.95. Following saturation, the sand specimen was
isotropically consolidated to an effective stress of 50 kPa.
Figure 1. Grain size distribution curve and limits in the gradation curves
(A- Boundaries for most liquefiable soil, B-Boundaries for Potentially
liquefiable soil) separating liquefiable and non-liquefiable soils.
3.3
Cyclic loading and data acquisition
Before the application of cyclic load an air pocket at the top of
the triaxial chamber was formed by draining water from the cell
without allowing the cell pressure to drop. Then cyclic loading
was applied on the soil specimens using the stress-controlled
method. The cyclic triaxial strength tests were conducted under
undrained conditions to simulate essentially undrained field
conditions duri g an earthquake or dynamic loading. The tests
w re conducted at a constant Cyclic Stress Ratio (CSR =
(σ
dc
/2 , where (σ
dc
= cyclic deviator stress and
= effective
confining pressure). CSR was varied from 0.15 to 0.45 at the
int rval of 0.05. In the e tire test program, a harmonic loading
was applied using s ne wav with a frequency of 1 Hz, the
maximum peak-peak axial strain 10%, the number of cycles
limited to 100 cycles and a recording speed of 50 numbers of


