1548
Proceedings of the 18
th
International Conference on Soil Mechanics and Geotechnical Engineering, Paris 2013
Proceedings of the 18
th
International Conference on Soil Mechanics and Geotechnical Engineering, Paris 2013
the sand, solidification material, and tension stiffener. Curing
time for the specimens was 3 days.
2.4
Test condition and method
Table 1 shows the testing conditions. Fracture morphology of
the specimens was anticipated to change due to additive
percentages of solidifying material. Therefore, a target strength
was set at 50 kN/m
2
for unconfined compressive strength,
which is considered to be a reasonable strength against
liquefaction (Zen, 1994). The additive percentage rate was set at
2% cement. In addition, recycled Bassanite only mixing gave
concerns of large variation in the strength and elution of
fluorine. For that reason, it was mixed with cement (C = 1% +
B = 5 %). For another set of tests, the addition rate was set at
1% cement and 1% short fiber. The termination condition of the
drained monotonic shear test and undrained monotonic shear
test is when axial strain of 15% is reached. Undrained cyclic
shear tests were carried out under sine-wave stress control with
a load speed of 0.1 Hz. In addition, the degree of saturation
(Skempton’s B) of the specimens in all conditions was more
than 0.96. The frequency of number of repetitions over the
same time period was substituted for duration of the ground
motions.
3
RESULTS AND DISCUSSIONS
3.1
Suppression method of liquefaction by solidification
Table 2 shows the strength parameters determined with Mohr's
stress circles from the drained monotonic shear tests. For the
case of C = 0%, cohesion is 0 kN/m
2
. On the other hand, for the
case of C = 2%, cohesion is increased to 27.3 kN/m
2
by the
addition of cement. Additionally, for the case of C = 1%+B =
5%, cohesion is found to increase to 36.4 kN/m
2
due to the
addition of recycled Bassanite. The increase of liquefaction
resistance is induced by the cohesion.
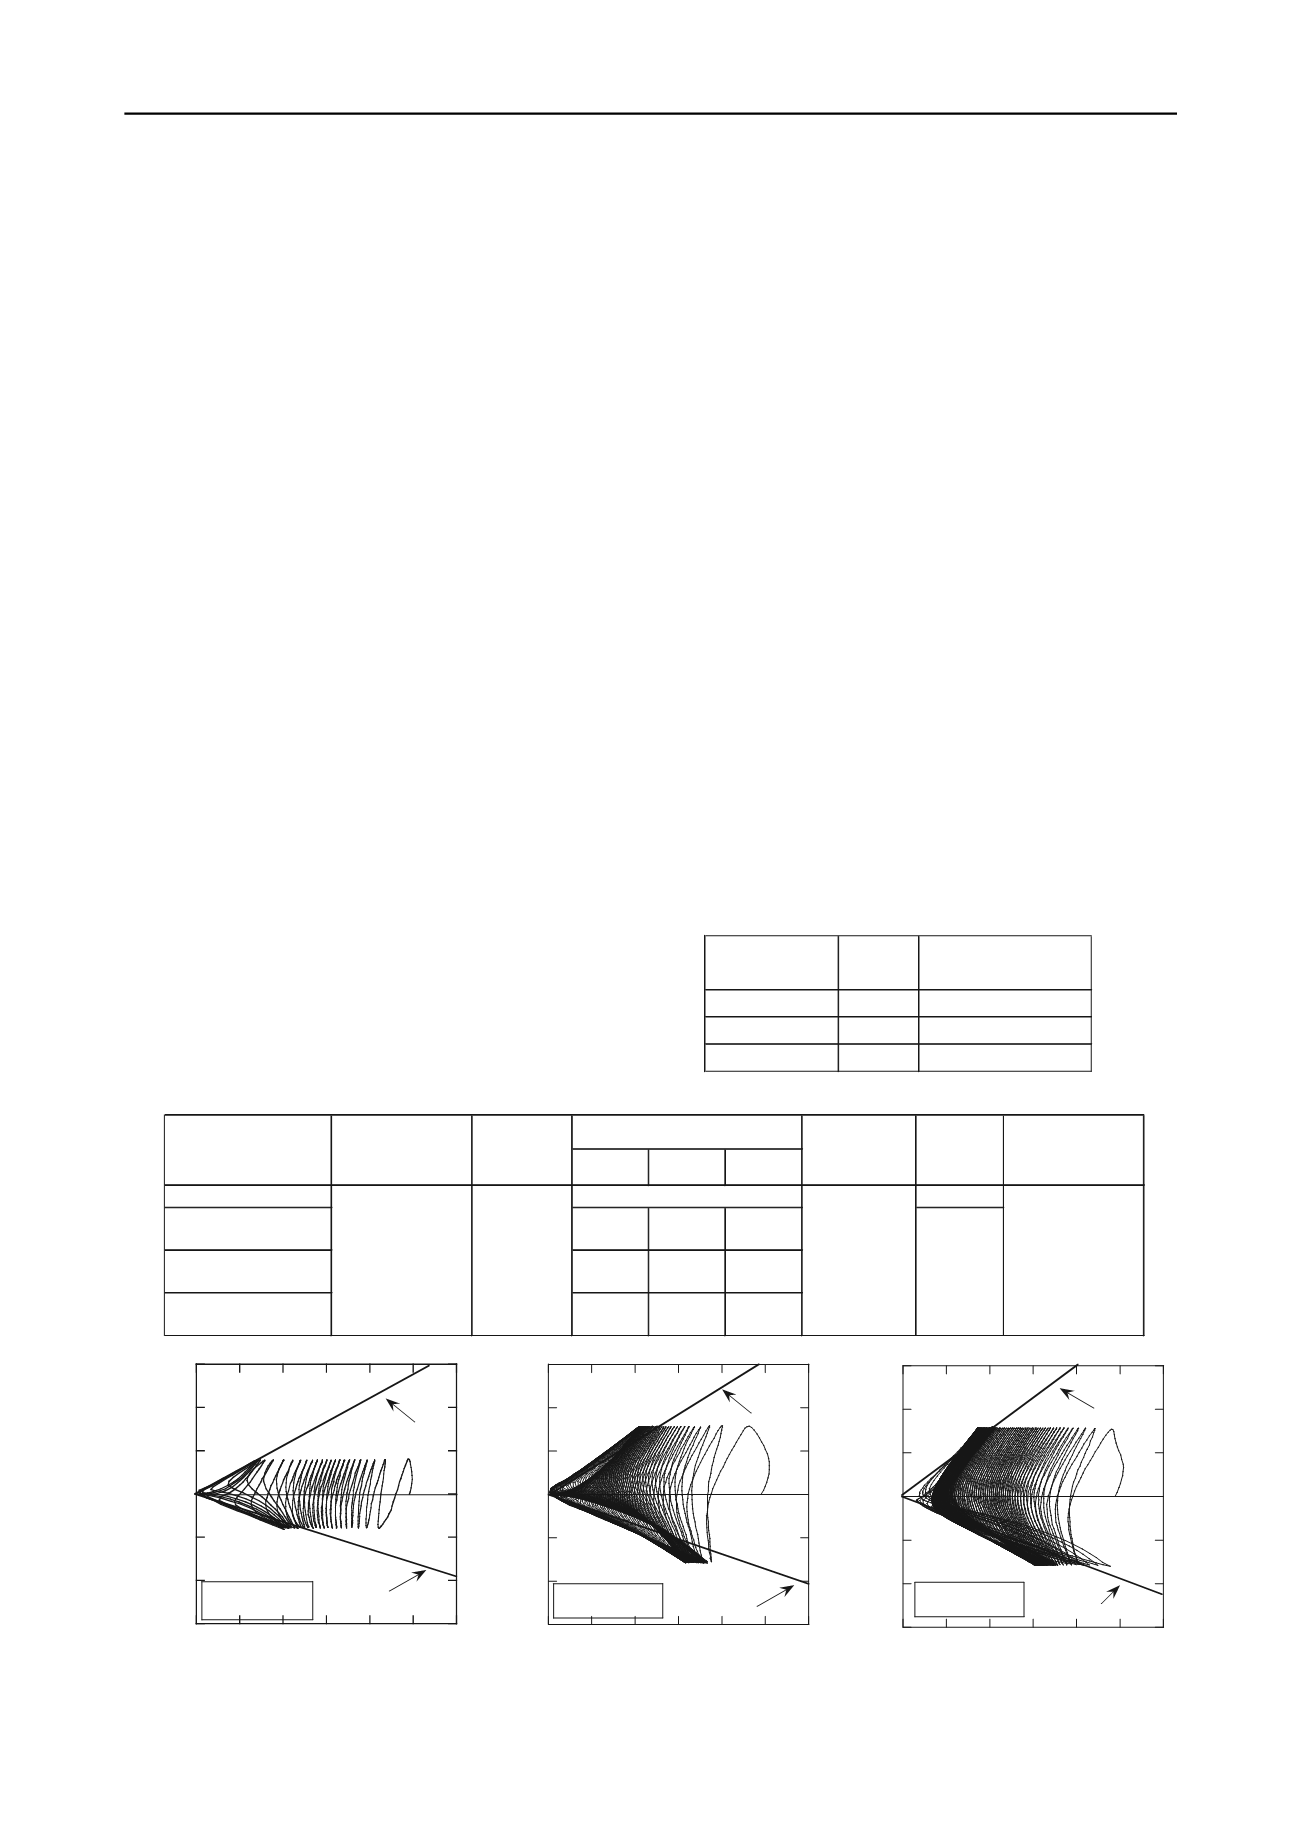
Figure 1 (a) - (c) shows the effective stress path diagram for
each condition resulting from the undrained cyclic shear tests.
For the case of C = 0%, effective stress is decreased with
increased number of cycles and shows cyclic mobility. This
shows a typical liquefaction behavior for sand. For the case of
C = 2% and C = 1% + B = 5%, in the event of addition of
solidification material, the number of cycles is increased
irrespective of the double cyclic stress ratio. The stress path for
mixing solidification material shows cyclic mobility after
reaching the phase transformation lines (PT line). The reason
for this behavior is a interparticles forces for the sand with
solidification.
Figure 2 shows the relationships between number of cycles
and maximum pore pressure ratio for each solidification
material additive condition. For the case of C = 0%, the trend
changes from about
/ p
c
' = 0.6, as it reaches liquefaction. In
contrast to this, for the case of added solidification material,
greater excess pore water pressure occurs in early phases of
shear, because the cyclic deviator stress ratio is high. Since the
maximum pore pressure ratio 1.0 is reached slowly, liquefaction
is not reached as quickly. In the case of recycled Bassanite, the
excess pore water pressure ratio does not reach 1.0. This is
thought to suppress pore pressure development between the
sand particles due to the solidification material. The excess pore
pressure is suppressed by the cement solidification effect and
the toughness of the recycled Bassanite.
Figure 3 shows the relationships between number of cycles
and double amplitude axial strain. For the case of C = 0%, the
strain increased significantly just before liquefaction. On the
other hand, for the case of C = 2%, the strain increases in the
early phases of shear with the development of excess pore
pressure. Then, the strain progresses slowly before reaching DA
= 5%. Additionally, for the case of C = 1% + B = 5%, the strain
increases more slowly than for the case of C = 2%.
Table 2. Strength parameter
Additive conditions Cohesion c'
Internal friction angle
φ
'
(%)
(kN/m
2
)
(°)
C = 0
0.0
34.0
C = 2
27.3
35.0
C = 1 + B = 5
36.4
33.0
Table 1. Test condition
C
B
F
Toyoura sand
0
Toyoura sand
+Cement (C)
2
0
0
Toyoura sand
+Recycled bassanite (B)
1
5
0
Toyoura sand
+PVA fiber (F)
1
0
1
30
50
100
200
Additive rate(%)
Examination item
Method of
preparing specimens
Water content
(%)
Confining press
of triaxial test
(kPa)
Curing days
Target
dry density
(g/cm
3
)
Tamping method
10
0
1.489
3
ure
-150
-100
-50
0
50
100
150
0 20 40 60 80 100 120
Deviator stress q (kPa)
Effective mean principal stress p' (kPa)
Toyoura Sand
C=0%
p'
c
0.20
d
=1.486(g/cm
3
)
PT Line
PT Line
(a) C=0%
Figure 1. Effective stress path diagram
-150
-100
-50
0
50
100
150
0 20 40 60 80 100 120
Deviator stress q (kPa)
Effective mean principal stress p' (kPa)
p'
c
0.40
d
=1.491(g/cm
3
)
Toyoura Sand
C=2%
PT Line
PT Line
(b) C=2%
-150
-100
-50
0
50
100
150
0 20 40 60 80 100 120
Deviator stress q (kPa)
Effective mean principal stress p' (kPa)
P'
c
0.40
d
=1.487(g/cm
3
)
Toyoura Sand
C=1%+B=5%
PT Line
PT Line
(c) C=1%+B=5%


