 
          1557
        
        
          Technical Committee 203 /


            Comité technique 203


          The horizontal forces are the hydrostatic loading


            U


            h


          , the active
        
        
          earth pressure acting on the upstream vertical face of the sliding
        
        
          block


            E


            A


          and the passive earth pressure acting on the
        
        
          downstream face


            E


            P


          . They were computed to be:


            U


            h


          100


            MN m


            E


            P


            E


            A


          15


            MN m


          (11)
        
        
          The factor of safety against block sliding is therefore


            FS


            S


            u


            U


            h


            E


            A


            E


            P


          144


            MN m


          100


            MN m


          15


            MN m


          1.6
        
        
          (12)
        
        
          Therefore, the dam was stable without the buttress. To stress the
        
        
          importance of this conclusions - based on crude estimations and
        
        
          simple analyses - a back-calculation can be performed. Failure
        
        
          might occurr if the shear strength in the sliding plane were
        
        
          85


            MN/m


          . After eqn. (10), this would imply a


            s


            u


          /


            p


          ratio 0.108,
        
        
          which inserted in eqn. (6) would in turn mean that the dam is
        
        
          founded on a continuous, horizontal layer with (N
        
        
          1
        
        
          )
        
        
          60
        
        
          = 10.
        
        
          4 NUMERICAL ANALYSIS
        
        
          4.1


            Hypotheses


          A simple 2D pushover analysis of the dam was performed
        
        
          numerically using Plaxis. The model geometry and mesh
        
        
          reproduce Figure 1; material parameters were estimated based
        
        
          on published information only (e.g., Barchiesi et al 2006,
        
        
          Carmona et al 2004) and are described below.
        
        
          A continuous horizontal layer 4m thick was assumed to be
        
        
          located 30m below the foundation level of the dam, running
        
        
          throughout the model. Construction stages were not simulated;
        
        
          the dam was activated in one drained loading step. For the
        
        
          pushover analy-ses, all materials were assumed drained except
        
        
          for the sand layer, where undrained behavior was enforced
        
        
          numerically. Due to its permeability and thickness, it was
        
        
          assumed that any cohesive layer would complete primary
        
        
          consolidation during the construction of the dam.
        
        
          4.2


            Description of the constitutive model


          The model focused on the progressive sliding deformations of
        
        
          the weak layer; only this material was modelled accurately
        
        
          using a constitutive model developed by Sfriso for the
        
        
          monotonic shear of sands (Sfriso and Weber 2010).
        
        
          The model is designed to simulate the behavior of sands in the
        
        
          whole stress and strain range of engineering interest, using state
        
        
          independent material parameters. The formulation is based on
        
        
          effective stresses, pressure dependent hyperelasticity, non-
        
        
          associative elasto-plasticity, an isotropic hardening law and
        
        
          Rowe’s stress-dilatancy theory (Sfriso and Weber 2010).
        
        
          4.3


            Material parameters and loading


          Shear modulus was computed using the Hardin and Drnevich
        
        
          (1972) expression


            G


            c


            s


            c


            e


            e


          2
        
        
          1


            e


            p


          100


            kPa


            m


          100


            kPa


          (13)
        
        
          where


            c


            s


          = 840,


            c


            e


          = 2.17,


            m


          = 0.50 and


            p


          is mean pressure.
        
        
          A Matsuoka-Nakai yield function was employed, calibrated for
        
        
          triaxial compression with the friction angle obtained using eqn.
        
        
          (4), where


            Δ


          ϕ
        
        
          = 3º,
        
        
          ϕ


            c


          = 31º,


            p


            r


          = 55, and


            R


          = 2º.
        
        
          A major issue is the estimation of relative density. A back-
        
        
          calculation of eqn. (5) to yield a


            s


            u


          /


            p


          = 0.18, as used in the rigid
        
        
          body calculations, would imply


            D


            r


          = 46%, a somewhat high
        
        
          value to expect undrained yielding (Sfriso 2010).  Therefore,
        
        
          numerical analyses were run adoptng


            D


            r


          in the range 30% -
        
        
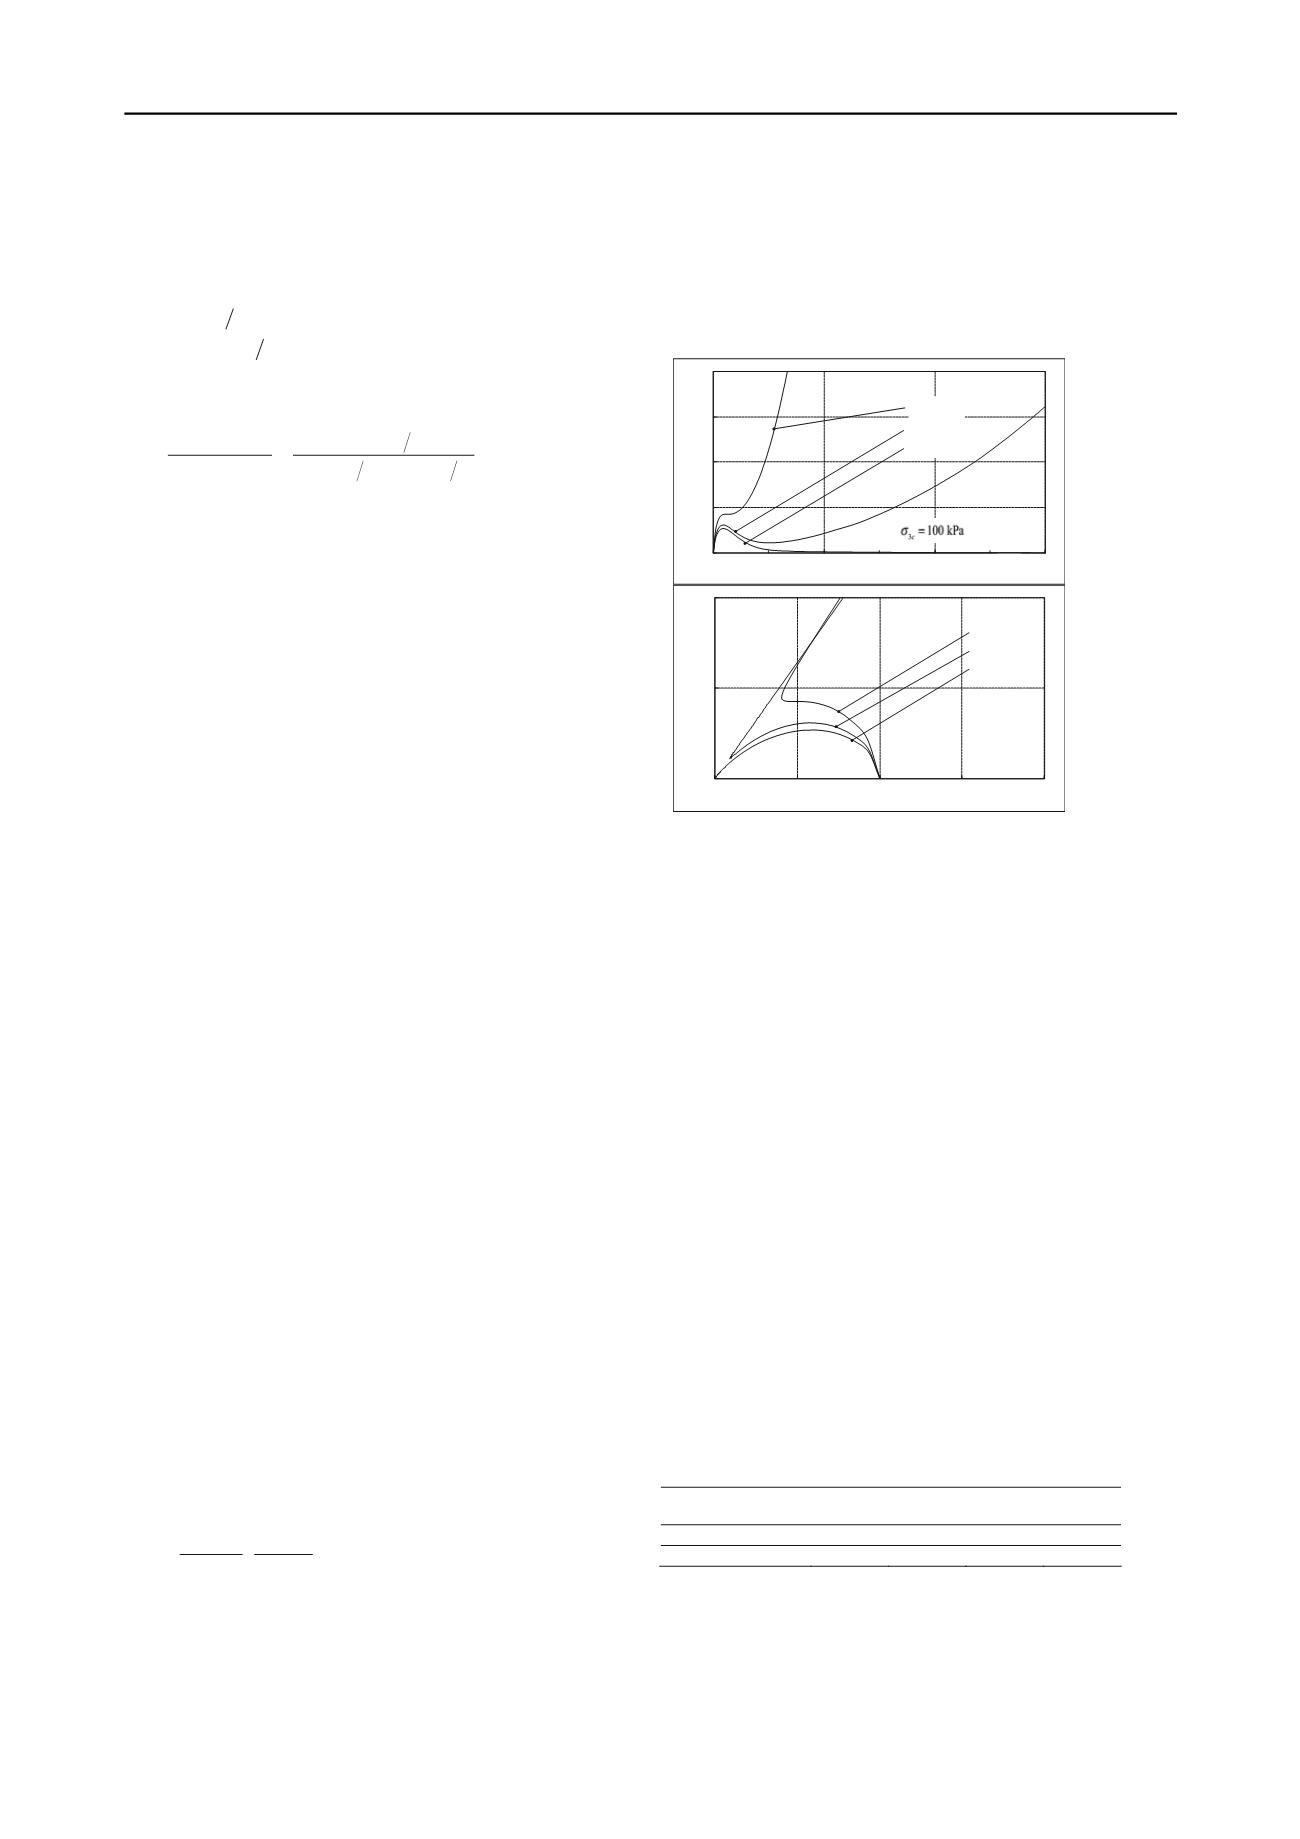
          45%. The resulting stress-strain and p-q plots for undrained
        
        
          triaxial compression are shown in Figure 2 for the


            D


            r


          = 15%,
        
        
          25% and 50% and for a confining pressure of 100kPa.
        
        
          0
        
        
          50
        
        
          100
        
        
          150
        
        
          200
        
        
          0.00
        
        
          0.01
        
        
          0.02
        
        
          0.03
        
        
          1


          50%
        
        
          25%
        
        
          15%


            r


            r


            r


            D


            D


            D


          kPa


            q


          0
        
        
          50
        
        
          100
        
        
          0
        
        
          50
        
        
          100
        
        
          150
        
        
          200
        
        
          50%
        
        
          25%
        
        
          15%


            r


            r


            r


            D


            D


            D


          kPa


            p


          kPa


            q


          Figure 2. p-q plot of the simulated undrained compression of the weak
        
        
          layers underlying the foundation of Potrerillos dam.
        
        
          The HSM model available in Plaxis (Brinkreve et al 2006) was
        
        
          employed for the remaining foundation and dam. Only the
        
        
          elastic parameters of the alluvium were of real interest for the
        
        
          analysis of progressive failure. However, due to the formulation
        
        
          of the HSM model, strength parameters do impact on the elastic
        
        
          response, and therefore all parameters required realistic values
        
        
          to yield a reliable prediction. The adopted values were


            E


            50


            ref


          = 80MPa,


            E


            oed


            ref


          = 90MPa,


            E


            ur


            ref


          = 200MPa, ν = 0.20,


            c


          = 1 kPa,
        
        
          ϕ


            = 45º, ψ


          = 10º


            ,


          OCR = 1.0. For the definitions of
        
        
          these parameters see Brinkgreve et al (2006).
        
        
          4.4


            Factor of safety


          The numerical computation of factor of safety is routinely
        
        
          performed in Plaxis using the "phi-c reduction" concept
        
        
          (Brinkreve et al 2006). For user defined soil models, Plaxis does
        
        
          not support the use of the "phi-c reduction" scheme and
        
        
          therefore an alternative definition must be attempted.
        
        
          In this contribution, two "factors of safety" are defined: i) FS
        
        
          1
        
        
          :
        
        
          the minimum factor augmenting the horizontal water load


            U


            h


          and yielding non-convergence of the field equations of the
        
        
          boundary value problem; and ii) FS
        
        
          2
        
        
          : the factor augmenting


            U


            h


          to yield a permanent displacement of 1m at the base of the
        
        
          concrete wall. The vertical component


            U


            v


          remained unchanged
        
        
          during both analyses. The results are shown in Table 1.
        
        
          Table 1. Factors of safety computed for various relative densities.
        
        
          Relative density
        
        
          30%
        
        
          35%
        
        
          40%
        
        
          45%
        
        
          FS
        
        
          1
        
        
          1.39
        
        
          2.45
        
        
          -
        
        
          -
        
        
          FS
        
        
          2
        
        
          1.16
        
        
          1.35
        
        
          1.64
        
        
          1.88
        
        
          The large differences that can be observed between the two
        
        
          factors of safety is due to the fact that the constitutive model
        
        
          goes beyond the phase transformation plateau into the dilating
        
        
          phase, as shown in Figure 2. FS
        
        
          1
        
        
          is not informed for


            D


            r


          = 40%
        
        
          and 45% because the failure mode was sliding at the foundation
        
        
          level of the dam instead of deep sliding along the sand layer.