1549
Technical Committee 203 /
Comité technique 203
Proceedings of the 18
th
International Conference on Soil Mechanics and Geotechnical Engineering, Paris 2013
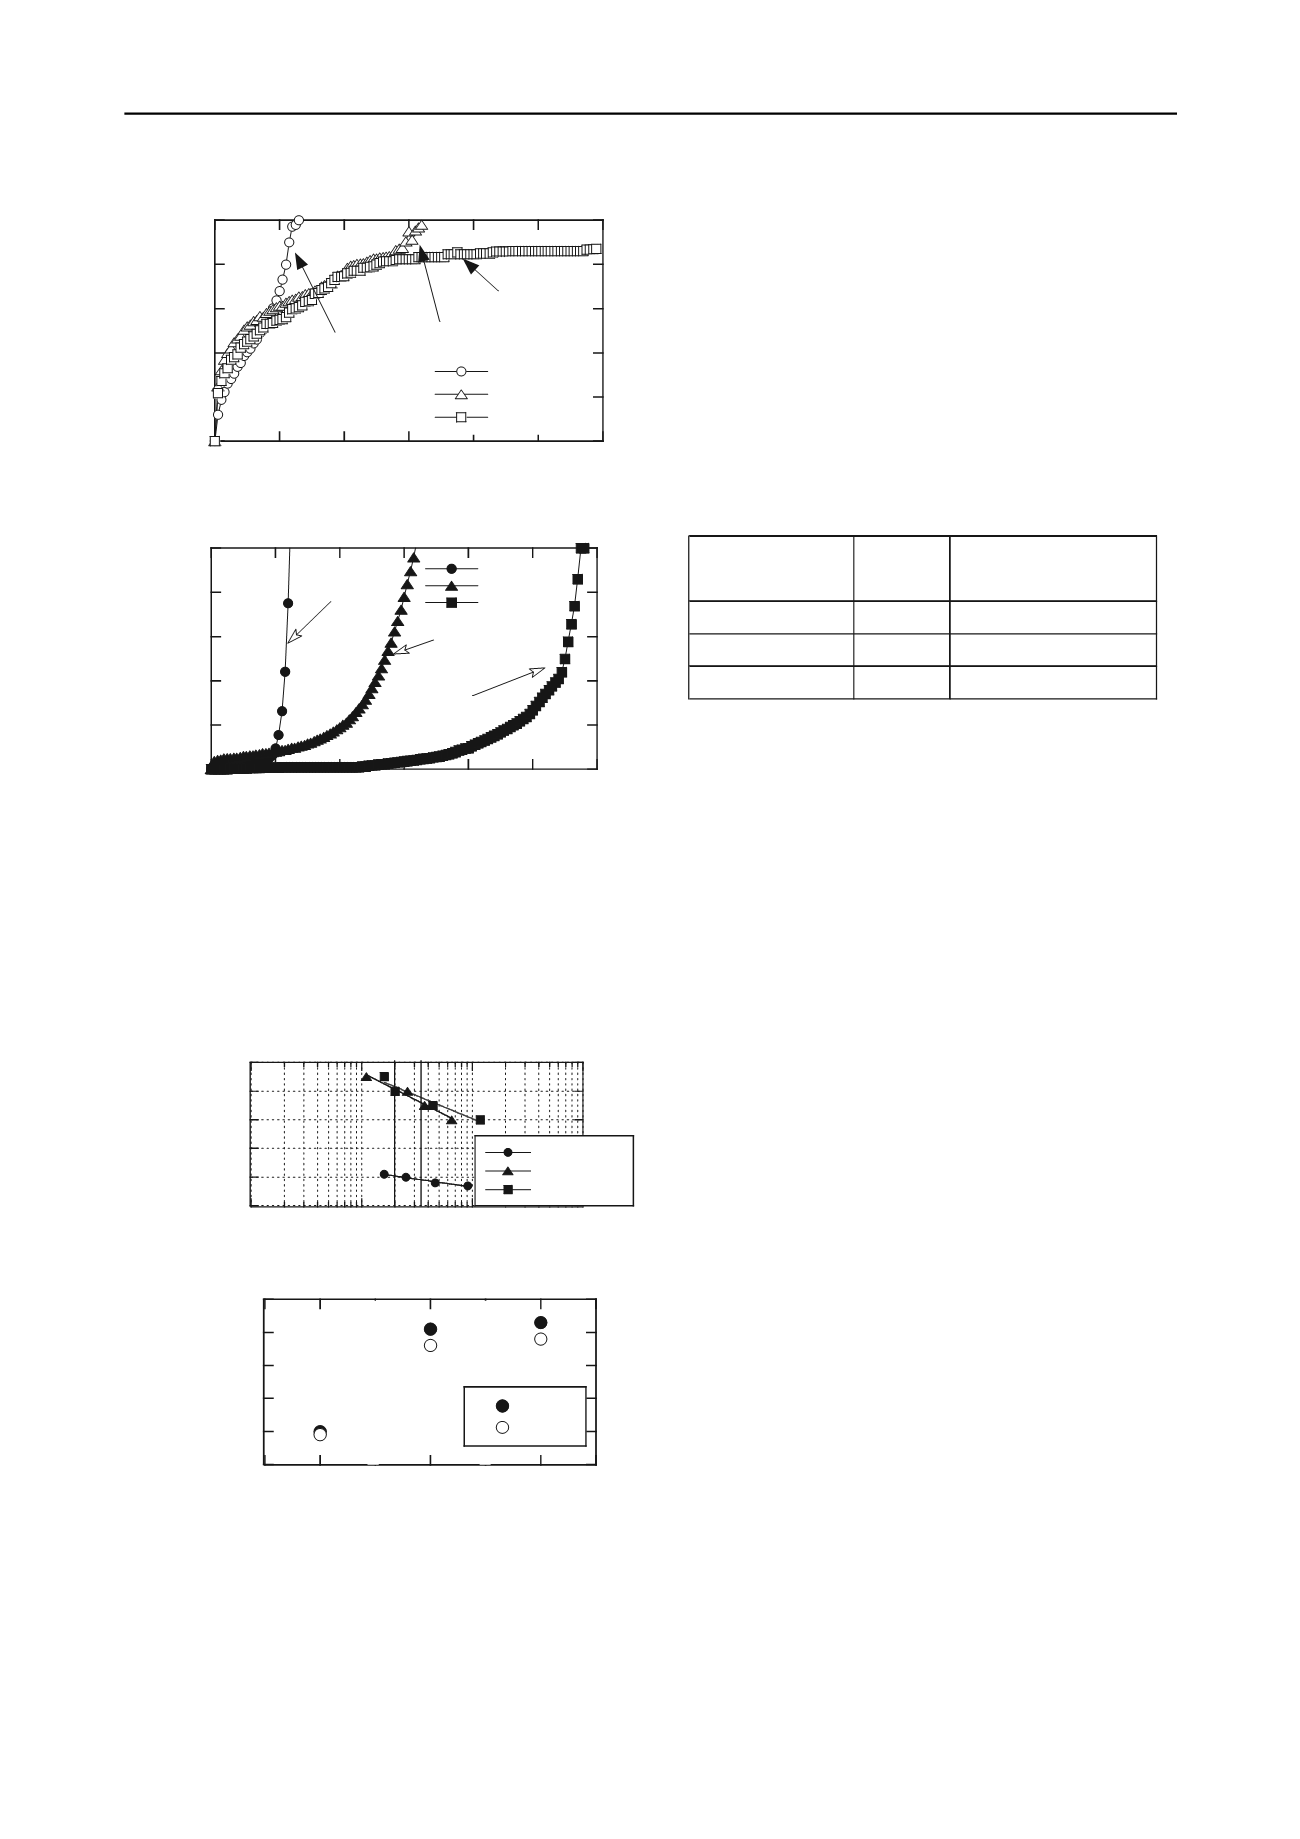
Figure 4 shows the liquefaction strength curve. For this
study, we assume that liquefaction occurs at DA = 5 %.
Focusing on the liquefaction strength N
20
, the improved soils
increased liquefaction strength by about 2.5 times, compared to
non-improved soil. The liquefaction strength required for an
earthquake of M 9.0 class such as the Great East Japan
Earthquake is assumed to be 34 times (Sezaki, 2011).
Figure 5 shows the relationships between additive
conditions and liquefaction strength. For the case of
liquefaction strength N
20
, the liquefaction strength with mixing
of solidification material makes no difference. However, for the
case of liquefaction strength N
34
, liquefaction strength of
mixing recycled Bassanite increases slightly. From this, for the
case of a large earthquake, the greater the development of
cohesions, the more chance there will be suppression of
liquefaction due to mixing of solidification material.
0
0.2
0.4
0.6
0.8
1
0 20 40 60 80 100 12
3.2 Suppression method of liquefaction by tension stiffener
Table 3 shows strength parameters determined from Mohr's
stress circles from the drained monotonic shear tests. The
cohesion increases due to an increase of the additive ratio of
tension stiffener and solidification material. These are
considered to be due to the added deformation restraint of the
specimens by the additional fibers and the interparticles force of
sand due to the cement.
Figure 6 (a) - (c) shows the effective stress path diagrams
for each condition for the undrained cyclic shear tests. (a) C =
0% and (b) C = 0% + F = 1% have the same cyclic stress ratio.
Focusing on the stress path (b) C = 0% + F = 1%, the decrease
in effective stress due to cycles is small due to the additional
fibers. The number of effective stress cycles path until the PT
line is however increased. It can be seen that there is an effect
of increasing the liquefaction resistance even with the addition
of only fibers. Then, for the case of (c) C = 1% + F = 1%, the
number of cycles for liquefaction is increased, regardless of
cyclic stress ratio. Cyclic mobility occurs after reaching the PT
line with increasing the additive ratio of the short fibers and
solidification material. These are thought to increase the
liquefaction resistance by restraint of deformation of the short
fibers and the interparticles forces of the sand due to the added
cement.
Figure 7 shows the relationships between number of cycles
and maximum pore pressure ratio for each conditions. The
development of the excess pore pressure ratio of non-improved
soil and for the addition of only short fibers reaches liquefaction
after it reaches
/p
c
’=0.6. Next, in the case of added short fibers
and solidification material, significant excess pore pressure
ratio occurs in early phases of the shear, because the cyclic
deviator stress ratio is great. But, the liquefaction does not rise
instantly. The excess pore pressure ratio approaches
/p
c
’ = 1.0
at a slow pace. This is thought to reflect the restraint of
deformation for cyclic behaviors depending on the addition of
short fibers and solidification material.
Figure 8 shows the relationships between number of cycles
and double amplitude axial strain. This figure indicates, that the
additional short fibers suppress the deformation to liquefaction.
Additionally, for the case of added solidification material, the
deformation does not advance instantly, even though the
effective stress is close to 0. The deformation reaches high
values at a slow pace.
Figure 9 shows the liquefaction strength curve. The
liquefaction strength for the addition of only short fibers shows
a little strength increase. In contrast to this, significant strength
increase is shown by adding more solidification material.
Figure 10 shows the relationships between additive
conditions
and
liquefaction
strength.
Liquefaction
countermeasures can be created by the addition of certain
solidifying material. Interestingly it is seen that more addition
of short fibers can also reduce the amount of solidification
material. This method may make effective use of waste by
0
C=0%
C=2%
C=1%+B=5%
(u/p
c max
Number of cycles N (cycles)
d
/2
c
'=0.40
d
/2
c
'=0.40
d
/2
c
'=0.20
')
Figure 2. The relationships between number of cycles and max pore
pressure ratio
0
1
2
3
4
5
0 20 40 60 80 100 120
C=0%
C=2%
C=1%+B=5%
DA (%)
Number of cycles N (cycles)
d
/2
c
'=0.20
d
/2
c
'=0.40
d
/2
c
'=0.40
Figure 3. The relationships between number of cycles and double
amplitude axial strain
Table 3. Strength parameter
Additive conditions Cohesion c'
Internal friction angle
φ
'
(%)
(kN/m
2
)
(°)
C = 0
0.0
34.0
C = 0 + F = 1
24.2
40
C =1 + F = 1
64.6
40.5
0.1
0.2
0.3
0.4
0.5
0.6
1
10
100
1000
C=0%
C=2%
C=1%+B=5%
Cyclic deviator
stress ratio
/p'
c
Number of cycles N (cycles)
20 34
Figure 4. Liquefaction strength curve
0.1
0.2
0.3
0.4
0.5
0.6
N=20
N=34
Cyclic deviator
stress ratio
/p'
c
Additive conditions
C=0% C=2% C=1%+B=5%
Figure 5. The relationships between additive conditions and
liquefaction strength


