 
          1552
        
        
          Proceedings of the 18
        
        
          th
        
        
          International Conference on Soil Mechanics and Geotechnical Engineering, Paris 2013
        
        
          50mm in diameter and 200mm in height and subjected to a
        
        
          vertical pressure of 50 kPa. After consolidation, a specimen
        
        
          measuring 5 cm in diameter and 10 cm in height was formed.
        
        
          To prepare specimen from samples with an Iwakuni clay
        
        
          content 17% or less, the soil mixtures were placed in a mold in
        
        
          5 layers with each layer being compacted using a steel rammer
        
        
          with a prescribed number of blows. The compaction energy, E
        
        
          c
        
        
          ,
        
        
          was calculated as follows (Adachi et al., 2000):
        
        
          (1)
        
        
          where, W
        
        
          R
        
        
          is the rammer weight (=0.00116 kN), H is the drop
        
        
          height (m), NL is the number of layers (=5), N
        
        
          B
        
        
          is the number
        
        
          of blows per layer, and V is the volume of mold (m
        
        
          3
        
        
          ). Various
        
        
          compaction energies, E
        
        
          c
        
        
          , were obtained by changing H and N
        
        
          B
        
        
          .
        
        
          Each soil mixture was thoroughly mixed at an initial water
        
        
          content of w=11%. Given that the initial water content of a
        
        
          compacted soil sample does not change the properties of the
        
        
          clay, the water content was selected to allow the free passage of
        
        
          carbon dioxide. In order to improve the specimen saturation,
        
        
          carbon dioxide was first passed through the specimens before
        
        
          allowing water to percolate.
        
        
          In this research, soil samples with fines content


            F


            c


          =0, 9.8,
        
        
          14.7, 16.7% were formed at constant compaction energies,
        
        
          corresponding to


            E


            c


          =22, 51, 113, 324, 504, 1008 kJ/m
        
        
          3
        
        
          , and at
        
        
          constant relative densities of sand structure, i.e.,


            D


            r


          sc
        
        
          =0, 30, 50,
        
        
          65%. (Table.1)Note that for soil samples prepared under
        
        
          compaction energies of


            E


            c


          =504 and 1008 kJ/m
        
        
          3
        
        
          , the variation of
        
        
          granular void ratios with fines content is practically similar;
        
        
          therefore, considering the rammer used in the sample
        
        
          preparation, relative densities of the sand-clay mixtures cannot
        
        
          be changed even with higher compaction energies. Thus, the
        
        
          granular void ratios corresponding to these compaction energies
        
        
          can be considered as the minimum granular void ratios in these
        
        
          experiments.
        
        
          As mentioned earlier, for soil samples with fines contents
        
        
          greater than


            F


            c


          =19.6%, sample preparation by compaction was
        
        
          not possible; instead, the pre-consolidation method was
        
        
          employed. Depending on the normal consolidation condition,
        
        
          the granular void ratio of the pre-consolidated sample is unique
        
        
          for a given effective confining pressure.


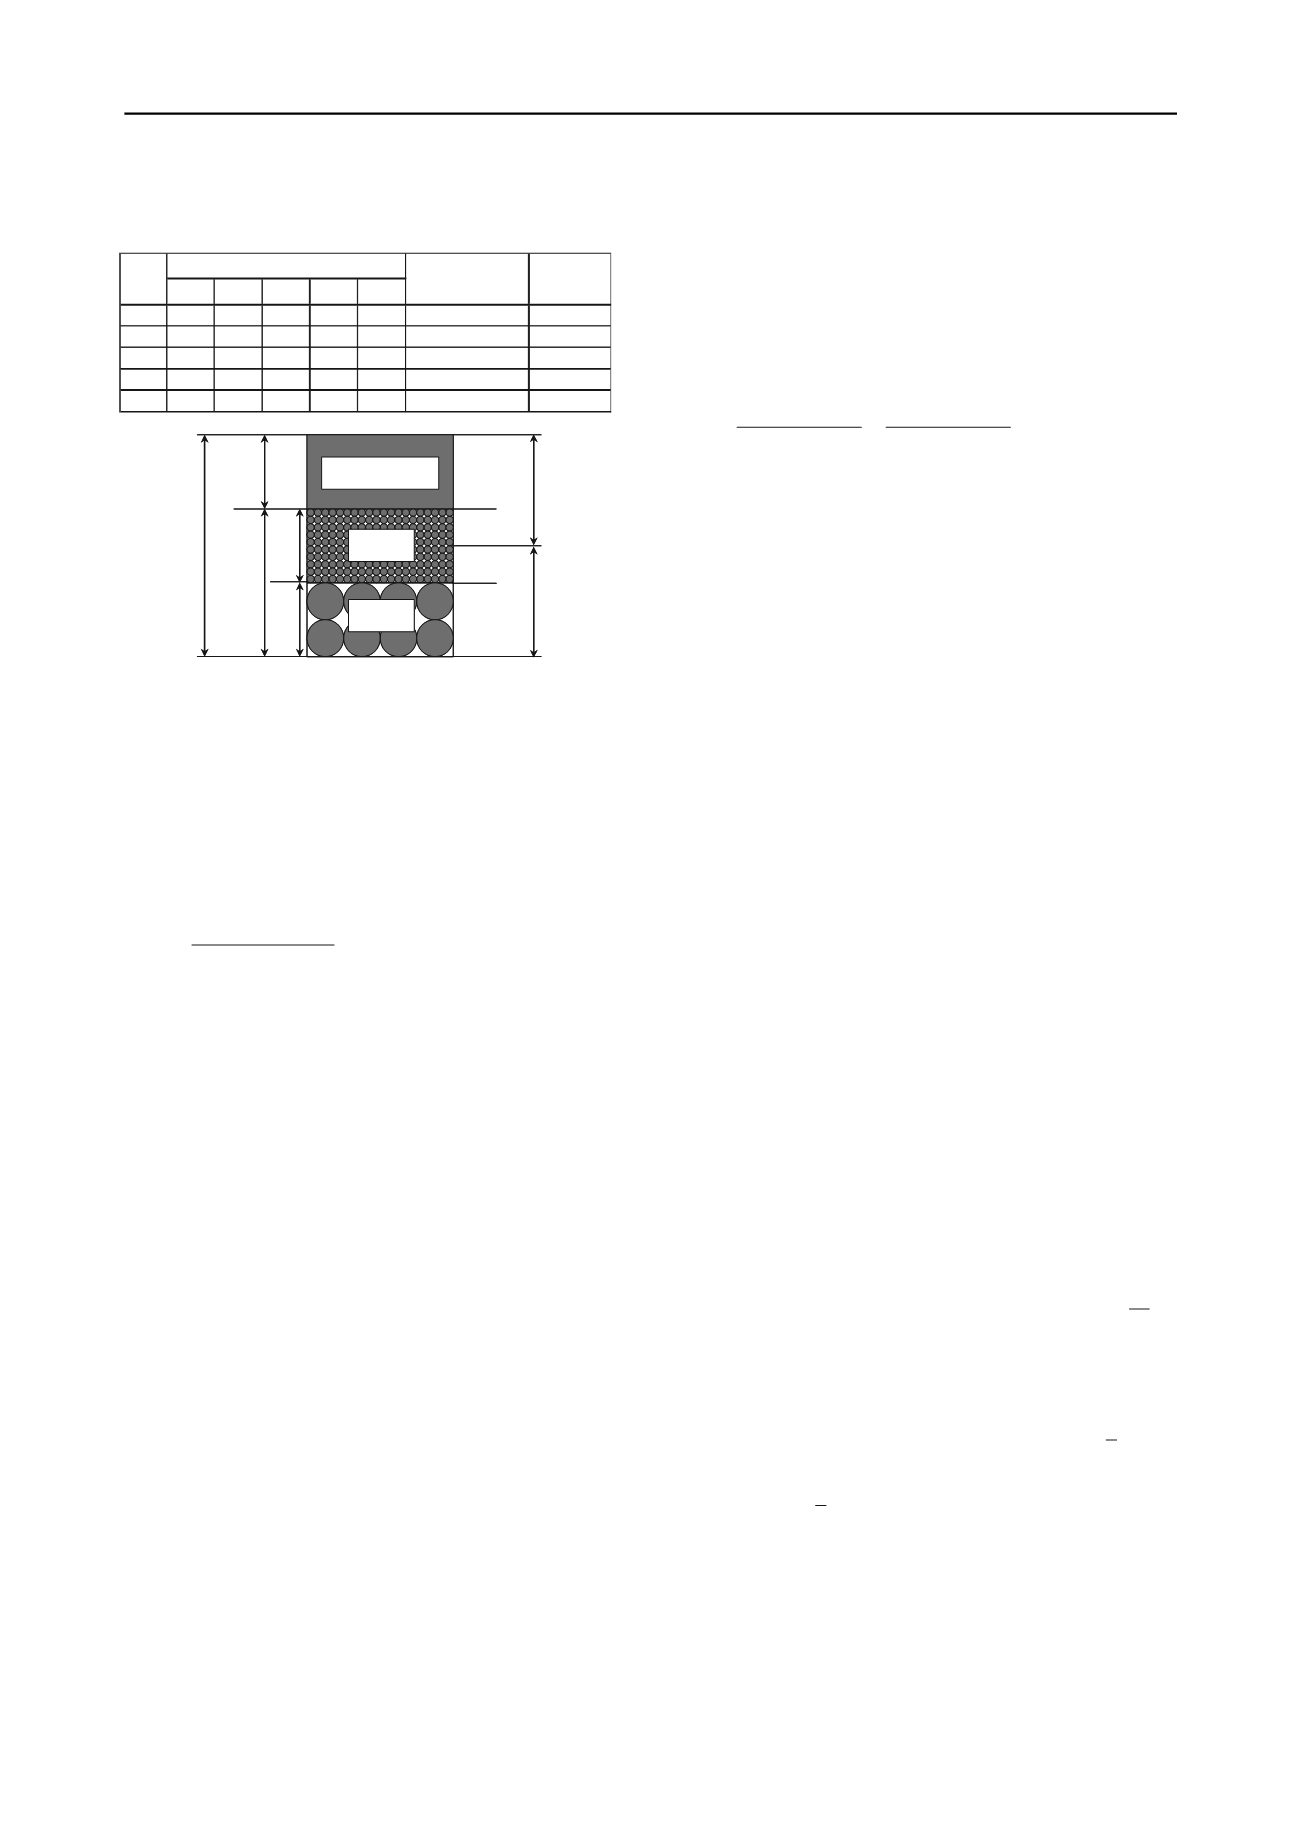
            2.3 Skeletal structure of sand-clay mixture


          A fully saturated sand-clay mixture has a three-phase
        
        
          composition, namely the coarse-grained particles, fine-grained
        
        
          particles and pore water, as shown in Fig. 2. Here,


            b


          is defined
        
        
          as the portion of fines that contributes to the active intergrain
        
        
          contacts. In Thevanayagam et al. (2002), it was introduced to
        
        
          represent the beneficial secondary cushioning effect of silica
        
        
          silts in silty sand as follows:
        
        
          (2)
        
        
          where


            e


          ge
        
        
          is  the  equivalent  granular void ratio,


            F


            c


          is the
        
        
          fines content (in terms of volume) and b denotes the portion of
        
        
          the fines that contributes to the active intergrain contacts.
        
        
          Basically,


            b


          =0 means that none of the fine grains actively
        
        
          participates in supporting the  coarse-grain  skeleton  (i.e.  the
        
        
          fines  act  exactly like  voids);  and


            b


          =1  implies  that  all  fines
        
        
          actively participate  in  supporting  the  coarse  grain  skeleton
        
        
          (i.e.  the  fines  are  indistinguishable  from  the  host sand
        
        
          particles). The magnitude of


            b


          depends on grain size disparity
        
        
          and grain characteristics.
        
        
          3 UNDRAINED CYCLIC SHEAR PROPERTIES
        
        
          The specimens of sand-clay soil mixtures prepared by
        
        
          compaction and pre-consolidation methods were isotropically
        
        
          consolidated at an effective confining pressure of


          c
        
        
          ’=100 kPa.
        
        
          Then, undrained cyclic triaxial tests were conducted with
        
        
          effective confining pressure


          c
        
        
          ’=100 kPa and loading frequency
        
        
          f=0.02Hz using an air pressure controlled cyclic triaxial test
        
        
          apparatus.
        
        
          Fig. 3 shows the relationship between the cyclic shear
        
        
          strength ratio (σd/2σc’) required to cause double amplitude
        
        
          axial strain ε
        
        
          DA
        
        
          =5% and the number of cycles (N) for soil
        
        
          specimens with fines mixtures (Iwakuni clay).
        
        
          Based on Fig.
        
        
          3(a), for specimens prepared under high compaction energy


            E


            c


          =504 kJ/m
        
        
          3
        
        
          , the liquefaction strength decreases as the fines
        
        
          content increases, with the liquefaction strength of specimens
        
        
          with


            F


            c


          =14.7% significantly smaller than those of specimens
        
        
          with


            F


            c


          =0% and 9.8%. On the other hand, for specimens
        
        
          prepared under a low compaction energy


            E


            c


          =22 kJ/m
        
        
          3
        
        
          (Fig.
        
        
          3(b)), although the difference between the liquefaction curves of
        
        
          various samples are small, there is a tendency for the
        
        
          liquefaction strength to increase with an increase in fines
        
        
          content.
        
        
          Next, the results of specimens prepared under constant
        
        
          fines content


            F


          c
        
        
          =0% (Fig. 3(c)) shows that the liquefaction
        
        
          strength increases as the compaction energy increases, with the
        
        
          liquefaction strength of specimen with


            E


            c


          =22, 51 kJ/m
        
        
          3
        
        
          significantly smaller than those of specimens with


            E


            c


          > 113
        
        
          kJ/m
        
        
          3
        
        
          . On the other hand, for specimens prepared under
        
        
          constant fines content


            F


          c
        
        
          =16.7% (Fig. 3(d)), it is also observed
        
        
          that there is increase in strength as the compaction energies
        
        
          increased. However, the liquefaction strengths show almost
        
        
          similar values.
        
        
          Fig. 3(e) shows the result of the pre-
        
        
          consolidation samples for Iwakuni clay mixtures (


            F


          c
        
        
          >19.6%).
        
        
          The cyclic shear strength ratios increase with fines content.
        
        
          However, in this case the liquefaction strengths show almost
        
        
          similar values (


            F


          c
        
        
          >29.4%).
        
        
          The cyclic shear strength corresponding to 20 cycles
        
        
          (hereinafter referred to as cyclic shear strength ratio,


            R


          L(N=20)
        
        
          ) is
        
        
          read off from the above curves and plotted against the fines
        
        
          content for Iwakuni clay mixtures, as shown in Fig. 4.
        
        
          A
        
        
          t
        
        
          constant relative density of sand structure, on the other hand,
        
        
          any increase in fines content results in an increase in cyclic
        
        
          strength. This can be explained as follows. In the case of
        
        
          constant relative density of sand structure, more fines will
        
        
          occupy the voids between the sand particles when the fines


            V


            NNHW E


            B L


            R


            c


            sf


            s


            sf


            v


            sf


            v


            V


            e


            sf


            ss


            eq


            b


            V


            Vb


            V


            bV V


            Vb


            V


          ) 1(
        
        
          ) 1(
        
        
          ) 1(


          1st
        
        
          2nd 3rd 4th 5th
        
        
          504 60 80 100 120 140
        
        
          0.184
        
        
          0.00116
        
        
          324 40 50 65 75 85
        
        
          0.184
        
        
          0.00116
        
        
          113 14 19 23 25 29
        
        
          0.184
        
        
          0.00116
        
        
          51 4 7 10 13 16
        
        
          0.184
        
        
          0.00116
        
        
          22 5 10 15 25 30
        
        
          0.050
        
        
          0.00116
        
        
          Number of dropping per a layer


            E


            c


          (kJ/m
        
        
          3
        
        
          )
        
        
          Height of dropping
        
        
          weight
        
        
          (m)
        
        
          Weight of
        
        
          rummer
        
        
          (kN)
        
        
          Table. 1
        
        
          Relation between dropping number and
        
        
          compaction energy


            e


            ge


            V


            v


          =


            e


            V


            s


          =1


            V


            sf


            V


            V


            ss


          (1-


            b


          )


            V


            sf


          Void
        
        
          Fines
        
        
          Sand
        
        
          1


            b


          ・


            V


            sf


          Fig. 2    Phase diagram