1550
Proceedings of the 18
th
International Conference on Soil Mechanics and Geotechnical Engineering, Paris 2013
Proceedings of the 18
th
International Conference on Soil Mechanics and Geotechnical Engineering, Paris 2013
utilization of recycled Bassanite has been verified. In the
future, it is important to study the suppression technique for
a variety of earthquakes, focusing attention on not only
suppression of liquefaction, but also recycling costs.
recycling of waste wood from earthquake damage and bamboo
chips.
4. CONCLUSIONS
(1) The liquefaction resistance is increased, due to the increase
of cohesion from the added solidification material. For the
added solidification material, the interparticles forces of
sand due to this cohesion suppresses liquefaction. The
magnitude of the suppression effect of liquefaction is
influenced by the interparticles forces of the sand.
5. ACKNOWLEDGEMENTS
The study presented in this paper was supported by Professor
Timothy A. Newson (University of Western Ontario) and Dr.
Takuro Fujikawa. This support is gratefully acknowledged.
(2) The effect of shear deformation suppression also increases
due to the development of apparent cohesion. For the case
of short fiber and solidification material, liquefaction is
suppressed by the cohesion of solidification material and
shear deformation suppression.
6. REFERENCES
(3) It is considered from the study results that, the utilization of
discharged wood waste by the earthquake will have a
similar effect as the effect of shear deformation suppression
Yasuda S. 2011. The liquefaction damage of KANTO. Board of
Tohoku-Pacific Ocean Earthquake disaster investigation report (in
Japanese).
Sasaki T. 2012. River bank and liquefaction. Public Works Research
Institute,
/
of the short fibers. Additionally, the effectiveness of the
Zen K. 1994. Remedial Measures for Reclaimed Land by Premixing
Method.
The Japanese Society of Soil Mechanics and Foundation
Engineering
, Vol.42, No.2, 37-42 (in Japanese).
0
0.2
0.4
0.6
1
0.8
Sezaki M. 2011. Liquefaction and slope failures in the Great East Japan
Earthquake.
Text of road technology workshops
(in Japanese).
-150
-100
-50
0
50
100
150
0 20 40 60 80 100 120
Deviator stress q (kPa)
Effective mean principal stress p' (kPa)
Toyoura Sand
C=0%
p'
c
0.20
d
=1.486(g/cm
3
)
PT Line
PT Line
(a) C=0%
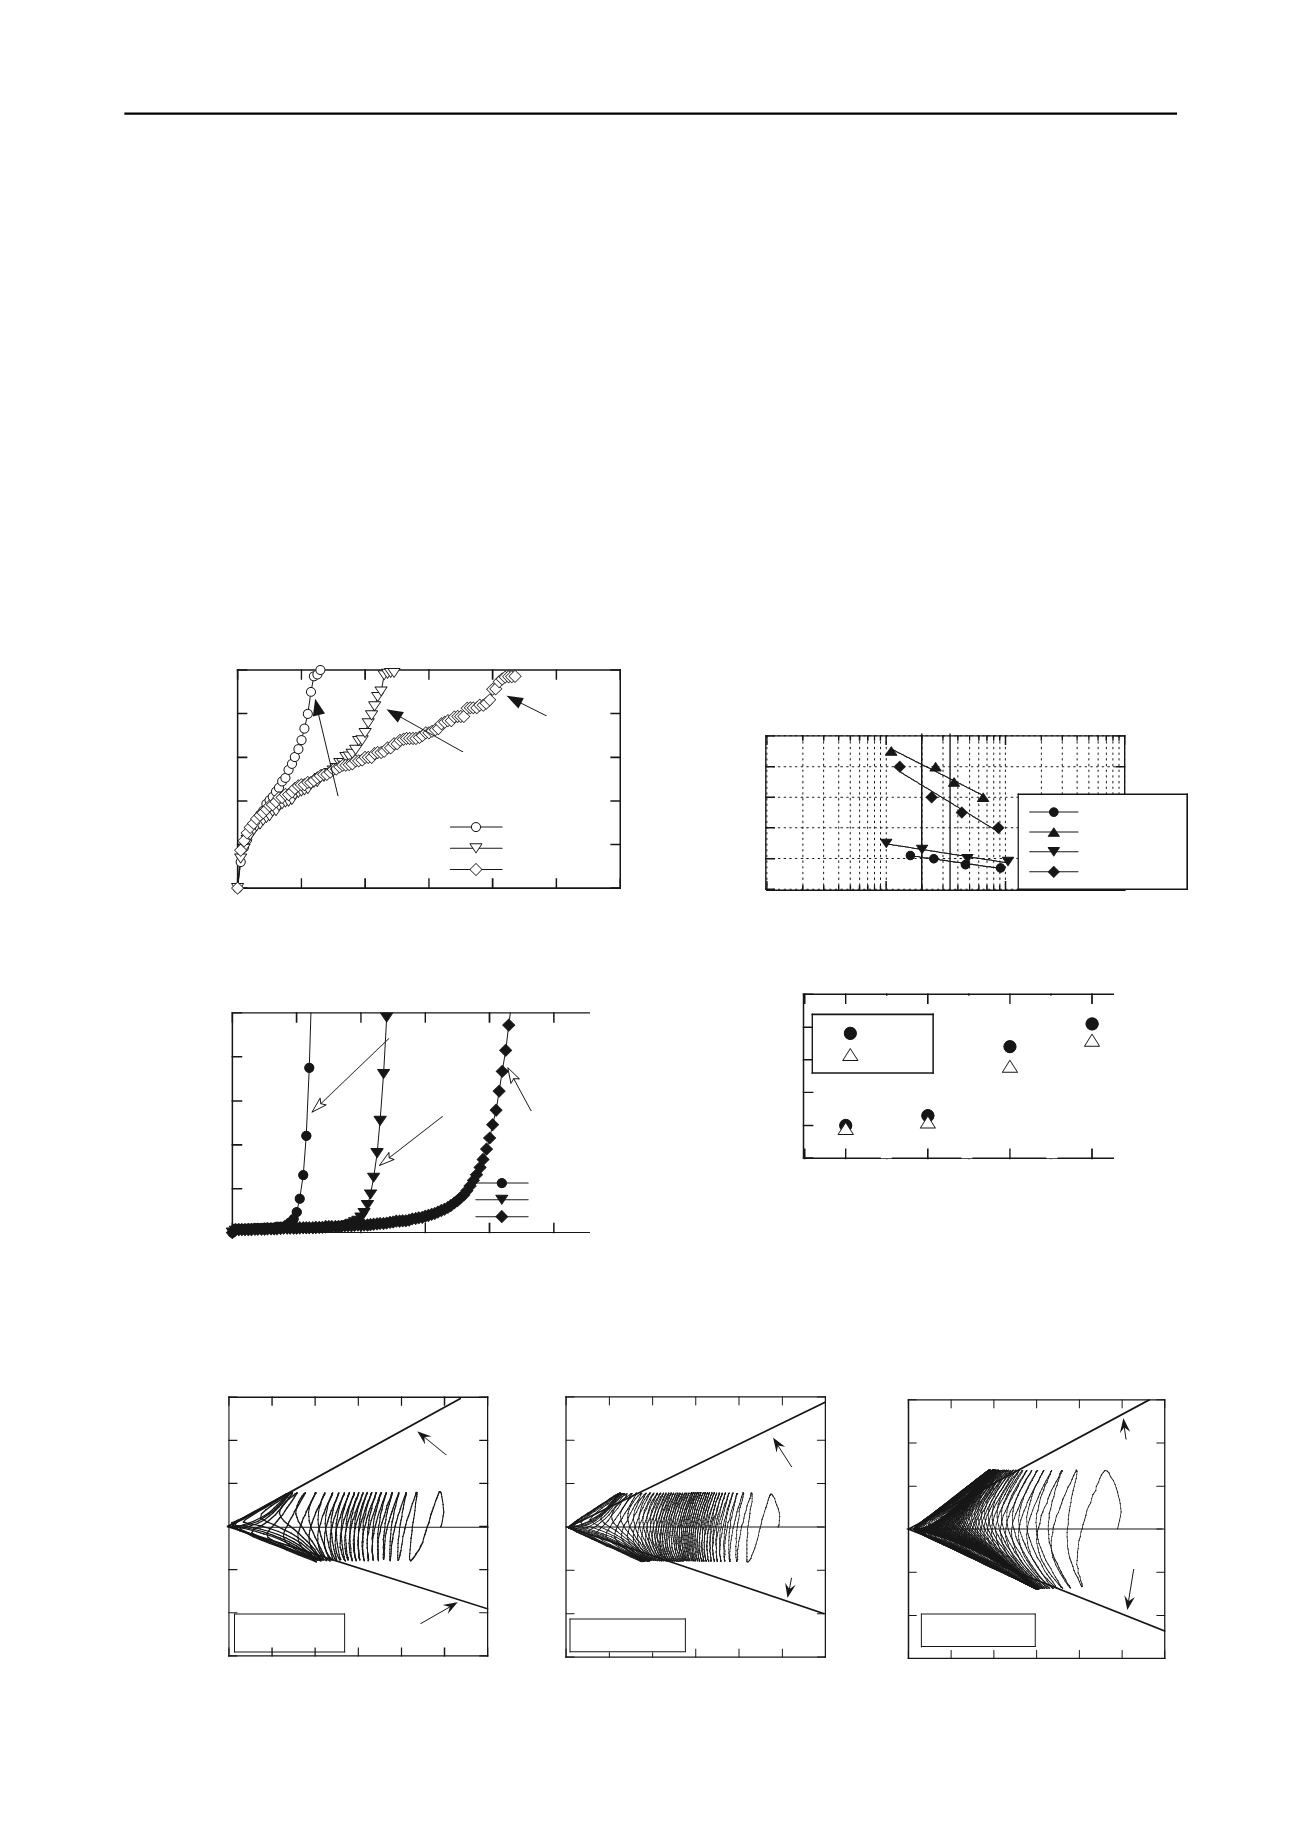
Figure 6. Effective stress path diagram
-150
-100
-50
0
50
100
150
0 20 40 60 80 100 120
Deviator stress q (kPa)
Effective mean principal stress p' (kPa)
Toyoura Sand
C=0%+F=1%
d
=1.489(g/cm
3
)
p'
c
PT Line
PT Line
(b) C=0%+F=1%
-150
-100
-50
0
50
100
150
0 20 40 60 80 100 120
Deviator stress q (kPa)
Effective mean principal stress p' (kPa)
Toyoura
C=1%+F=1%
P'
c
d
=1.481(g/cm
3
)
PT Line
PT Line
(c) C=1%+F=1%
0 20 40 60 80 100 120
C=0%
C=0%+F=1%
C=1%+F=1%
(u/p
c
')
max
Number of cycles N (cycles)
d
/2
c
'=0.35
d
/2
c
'=0.20
d
/2
c
'=0.20
0.1
0.2
0.3
0.4
0.5
0.6
1
10
100
1000
C=0%
C=2%
C=0%+F=1%
C=1%+F=1%
Cyclic deviator
stress ratio
/p'
c
Number of cycles N (cycles)
DA=5%
Figure 7. The relationships between number of cycles and max pore
pressure ratio
0
1
2
3
4
5
0 20 40 60 80 100 12
Figure 9. Liquefaction strength curve
0.1
0.2
0.3
0.4
0.5
0.6
N=20
N=34
Cyclic deviator
stress ratio
/p'
c
Additive conditions
C=0%
C=2%
C=1%
+F=1%
C=0%
+F=1%
0
C=0%
C=0%+F=1%
C=1%+F=1%
DA (%)
Number of cycles N (cycles)
d
/2
c
'=0.20
d
/2
c
'=0.35
d
/2
c
'=0.20
Figure 10. The relationships between additive conditions and
liquefaction strength
Figure 8. The relationships between number of cycles and double
amplitude axial strain
recycling of waste wood from earthquake damage and
bamboo
chips.
4. CONCLUSIONS
(1) The liquefaction resistance is increased, due to the
increase of cohesion from the added solidification
material. For the added solidification material, the
interparticles fo ces of sand due to this cohesion
suppr ses liquefaction. The m gnitude of the
suppression effect of liquefaction is influenced by the
i terparticles forces of the sand.
(2) The eff ct of shear deformation suppression lso
incr as s due to the development of apparent
cohesion. For the cas f short fiber and solidification
material, liqu faction is suppressed by the cohesion of
solidification material and shear deformation
su pre sion.
(3) It is considered from the study results that, the
utilization of disc arged wood w ste by the
earthquake will have a similar effec as the effect of
shear de orm tion suppression
of the short fibers. Additionally, the effectiveness of
the
-150
-100
-50
0
50
100
150
0 20 40 60 80 100 120
Deviator stress q (kPa)
Effective mean principal stress p' (kPa)
Toyoura Sand
C=0%
p'
c
0.20
d
=1.486(g/cm
3
)
PT Line
PT Line
(a) C=0%
Figure 6. Effective stress path diagram
-150
-100
-50
0
50
100
150
0 20 40 60 80 100 120
Deviator stress q (kPa)
Effective mean principal stress p' (kPa)
Toyoura Sand
C=0%+F=1
d
=1.489(g/cm
3
)
p'
c
PT Line
PT Line
(b) C=0%+F=1%
-150
-100
-50
0
50
100
150
0 20 40 60 80 100 120
Deviator stress q (kPa)
Effective mean principal stress p' (kPa)
Toyoura
C=1%+F=1%
P'
c
d
=1.481(g/cm
3
)
PT Line
PT Line
(c) C=1%+F=1%
0
0.2
0.4
0.6
0.8
1
0 20 40 60 80 100 120
C=0%
C=0%+F=1%
C=1%+F=1%
(u/p
c
')
max
Number of cycles N (cycles)
d
/2
c
'=0.35
d
/2
c
' 0.20
d
/2
c
'=0.20
Figure 7. The relationships between number of cycles and max pore
0.1
0.2
0.3
0.4
0.5
0.6
1
10
100
1000
C=0%
C=2%
C=0%+F=1%
C=1%+F=1%
Cyclic deviator
stress ratio
/p'
c
Number of cycles N (cycles)
DA=5%
pressure ratio
Figure 9. Liquefaction strength curve
0
1
2
3
4
5
0 20 40 60 80 100
C=0%
C=0%+F
C=1%+F
DA (%)
Number of cycles N (cycles)
d
/2
c
'=0.20
d
/2
c
'=0.35
d
/2
c
'=0.20
0.1
0.2
0.3
0.4
0.5
0.6
N=20
N=34
Cyclic deviator
stress ratio
/p'
c
Additive conditions
C=0%
C=2%
C=1%
+F=1%
C=0%
+F=1%
Figure 8. The relationships between number of cycles and
double amplitude axial strain
Figure 10. The relationships between additive conditions and
liquefaction strength
recycling of waste wood from earthqu ke damage a d
bamboo
chips.
4. CONCLUSIONS
(1) The liquefac ion resistance is increased, due to the
increase of cohe io from the ad ed solidification
mat rial. F r the adde li i i ti aterial, the
interparticl s f rces of sand due to this cohesion
suppr sses liquefaction. The magnitud of the
suppression effect of liquefac on is influenced by the
interparticles forc s of the sand.
(2) The effect of shear def mation suppress on also
inc e ses due t the development f appar nt
cohesion. For the case of short fiber and solidificati
mat rial, liquefacti n is suppresse by the cohesion of
solidi icat on material and sh ar deformation
uppression.
(3) It is considered from the study results that, the
utilization of discharged wood waste by the
earthquake will have a similar ef ct as he effect of
shear deformation suppression
of the short fibers. Additionally, the effectiveness of
the
-150
-1 0
-50
0
50
1 0
150
0 20 40 60 80 100 120
Deviator stress q (kPa)
ffective mean principal stress p' (kPa)
Toyoura Sand
C=0%
p'
c
0.20
d
=1.486(g/cm
3
)
PT Line
PT Line
(a) C=0%
Figure 6. Effective stress path diagram
-150
-1 0
-50
0
50
100
150
0 20 4 60 80 100 120
Deviator stress q (kPa)
Effective mean principal stress p' (kPa)
Toyoura Sand
C=0%+F=1%
d
=1.489(g/cm
3
)
p'
c
PT Line
PT Line
(b) C=0%+F=1%
-150
-1 0
-50
0
50
1 0
150
0 20 40 60 80 100 120
Deviator stress q (kPa)
Effective mean principal stress p' (kPa)
Toyoura
C=1%+F=1%
P'
c
d
=1.481(g/cm
3
)
PT Line
PT Line
(c) C=1%+F=1%
0
.2
0.4
0.6
0.8
1
0 20 40 60 80 100 120
C=0%
C=0%+F=1%
C=1%+F=1%
(u/p
c
')
max
Number of cycles N (cycles)
d
/2
c
'=0.35
d
/2
c
'=0.20
d
/2
c
'=0.20
Figure 7. The relationships between number of cycles and max pore
0.1
0.2
0.3
0.4
0.5
0.6
1
10
100
1000
C=0%
C=2%
C=0%+F=1%
C=1%+F=1%
Cyclic deviator
stress ratio
/p'
c
Number of cycles N (cycles)
DA=5%
pressure ratio
Figure 9. Liquefaction strength curve
0
1
2
3
4
5
0 20 40 60 80 100
C=0%
C=0%+F
C=1%+F
DA (%)
Number of cycles N (cycles)
d
/2
c
'=0.20
d
/2
c
'=0.35
d
/2
c
'=0.20
0.1
0.2
0.3
0.4
0.5
0.6
N=20
N 34
Cyclic deviator
stress ratio
/p'
c
Additive conditions
C=0%
C=2%
C=1%
+F=1%
C=0%
+F=1%
Figure 8. The relationships between number of cycles and
double amplitude axial strain
Figure 10. The relationships between additive conditions and
liquefaction strength
recycling of waste wood from earthquake damage and
bamboo
chips.
4. CONCLUSIONS
(1) The liquefaction resistanc is increased, due to the
increase of cohesion from the added solidification
material. For the added solidification material, the
interparticles f rces of sand due to this cohesion
suppr sses liquefaction. Th m gnitude of the
suppression e fect of liquefact on is influenced by the
inter art c es f ces of the sand.
(2) The ffec of shear deformation suppr ssion also
incr ases due to t e develo m nt of apparent
cohes on. For the case of sh t fib r and solid fication
materi l, liquefact n is suppressed by the cohesion of
solidification m teri l and
hear deformation
suppression.
(3) It is considered from the study results that, the
utilization of dis harged wood was e by the
earthquake will have a similar effect as the ef ect of
shear def rmation suppression
of the short fibers. Additiona ly, h eff ctiveness of
the
-150
-100
-50
0
5
100
150
0 20 40 60 80 100 120
Deviator stress q (kPa)
Effective mean principal stress p' (kPa)
Toyoura Sand
C=0%
p'
c
0.20
d
=1.486(g/cm
3
)
PT Line
PT Line
(a) C=0%
Figure 6. ff ctive str ss path diagram
-15
-100
-50
0
5
100
150
0 20 40 60 80 100 120
Deviator stress q (kPa)
Effective mean principal stress p' (kPa)
Toyoura Sand
C=0%+F=1%
d
=1.489(g/cm
3
)
p'
c
PT Line
PT Line
(b) C= %+F=1%
-15
-100
-50
0
5
100
150
0 20 40 60 80 100 120
Deviator stress q (kPa)
Effective mean principal stress p' (kPa)
Toyoura
C=1%+F=1%
P'
c
d
=1.481(g/cm
3
)
PT Line
PT Line
(c) C=1%+F=1%
0
0.2
0.4
0.6
0.8
1
0 20 40 60 80 100 120
C=0%
C=0%+F=1%
C=1%+F=1%
(u/p
c
')
max
Number of cycles N ( ycles)
d
/
c
'=0.35
d
/2
c
'=0.20
d
/2
c
'=0.20
Figure 7. The relationships between number of cycles and max pore
0.1
2
3
4
0 5
0.6
1
10
100
10 0
C=0%
C=2%
C=0%+F=1%
C=1%+F=1%
Cyclic deviator
stress ratio
/p'
c
Number of cycles N (cycles)
DA=5%
pressure ratio
Figure 9. Liquefaction strength curve
0
1
2
3
4
5
0 20 40 60 80 100
0
C=0%+F
C=1%+F
DA (%)
Number of cycles N (cycl )
d
/2
c
'=0.20
d
/2
c
'=0.35
d
/2
c
'=0.20
0.1
0.2
0.3
.4
0.5
.6
N=20
N=34
Cyclic deviator
stre s ratio
/p'
c
Additive conditions
C=0%
C=2%
C=1%
+F=1%
C=0%
+F=1%
Figure 8. The relationships between number of cycles and
double amplitude axial strain
Figure 10. The relationships between additive conditions and
liquefaction strength


