1562
Proceedings of the 18
th
International Conference on Soil Mechanics and Geotechnical Engineering, Paris 2013
CSR required to produce
DA
=5% in 15 cycles of uniform load
application; herein, this is referred to as (
CRR
)
triaxial
. The
conditions the laboratory specimens were subjected to were
different from those in-situ and corrections need to be applied to
the laboratory-obtained values before comparing with the in-situ
liquefaction resistance, (
CRR
)
field
. Due to space constraints,
these corrections are not presented in detail here; suffice it to
say that the following corrections were incorporated: (1)
correction due to difference in consolidation stress,
C
1
; (2)
correction due to sample disturbance,
C
3
; (3) correction due to
densification during handling,
C
4
; and (4) correction due to
loading direction,
C
5
. Moreover, all results are expressed in
terms of
c
’=100 kPa using
K
interpolated from Figure 3.
5 CONCLUSIONS
In order to investigate the liquefaction characteristics of pumice
sands, several series of undrained cyclic triaxial tests on
reconstituted and undisturbed pumice specimens were
performed as well as geotechnical investigations at sites of
pumiceous deposits. The major results are as follows:
(1) Although relative density has some noticeable effect on
the cyclic resistance of pumice, it was not as significant
when compared to that observed for hard-grained sands.
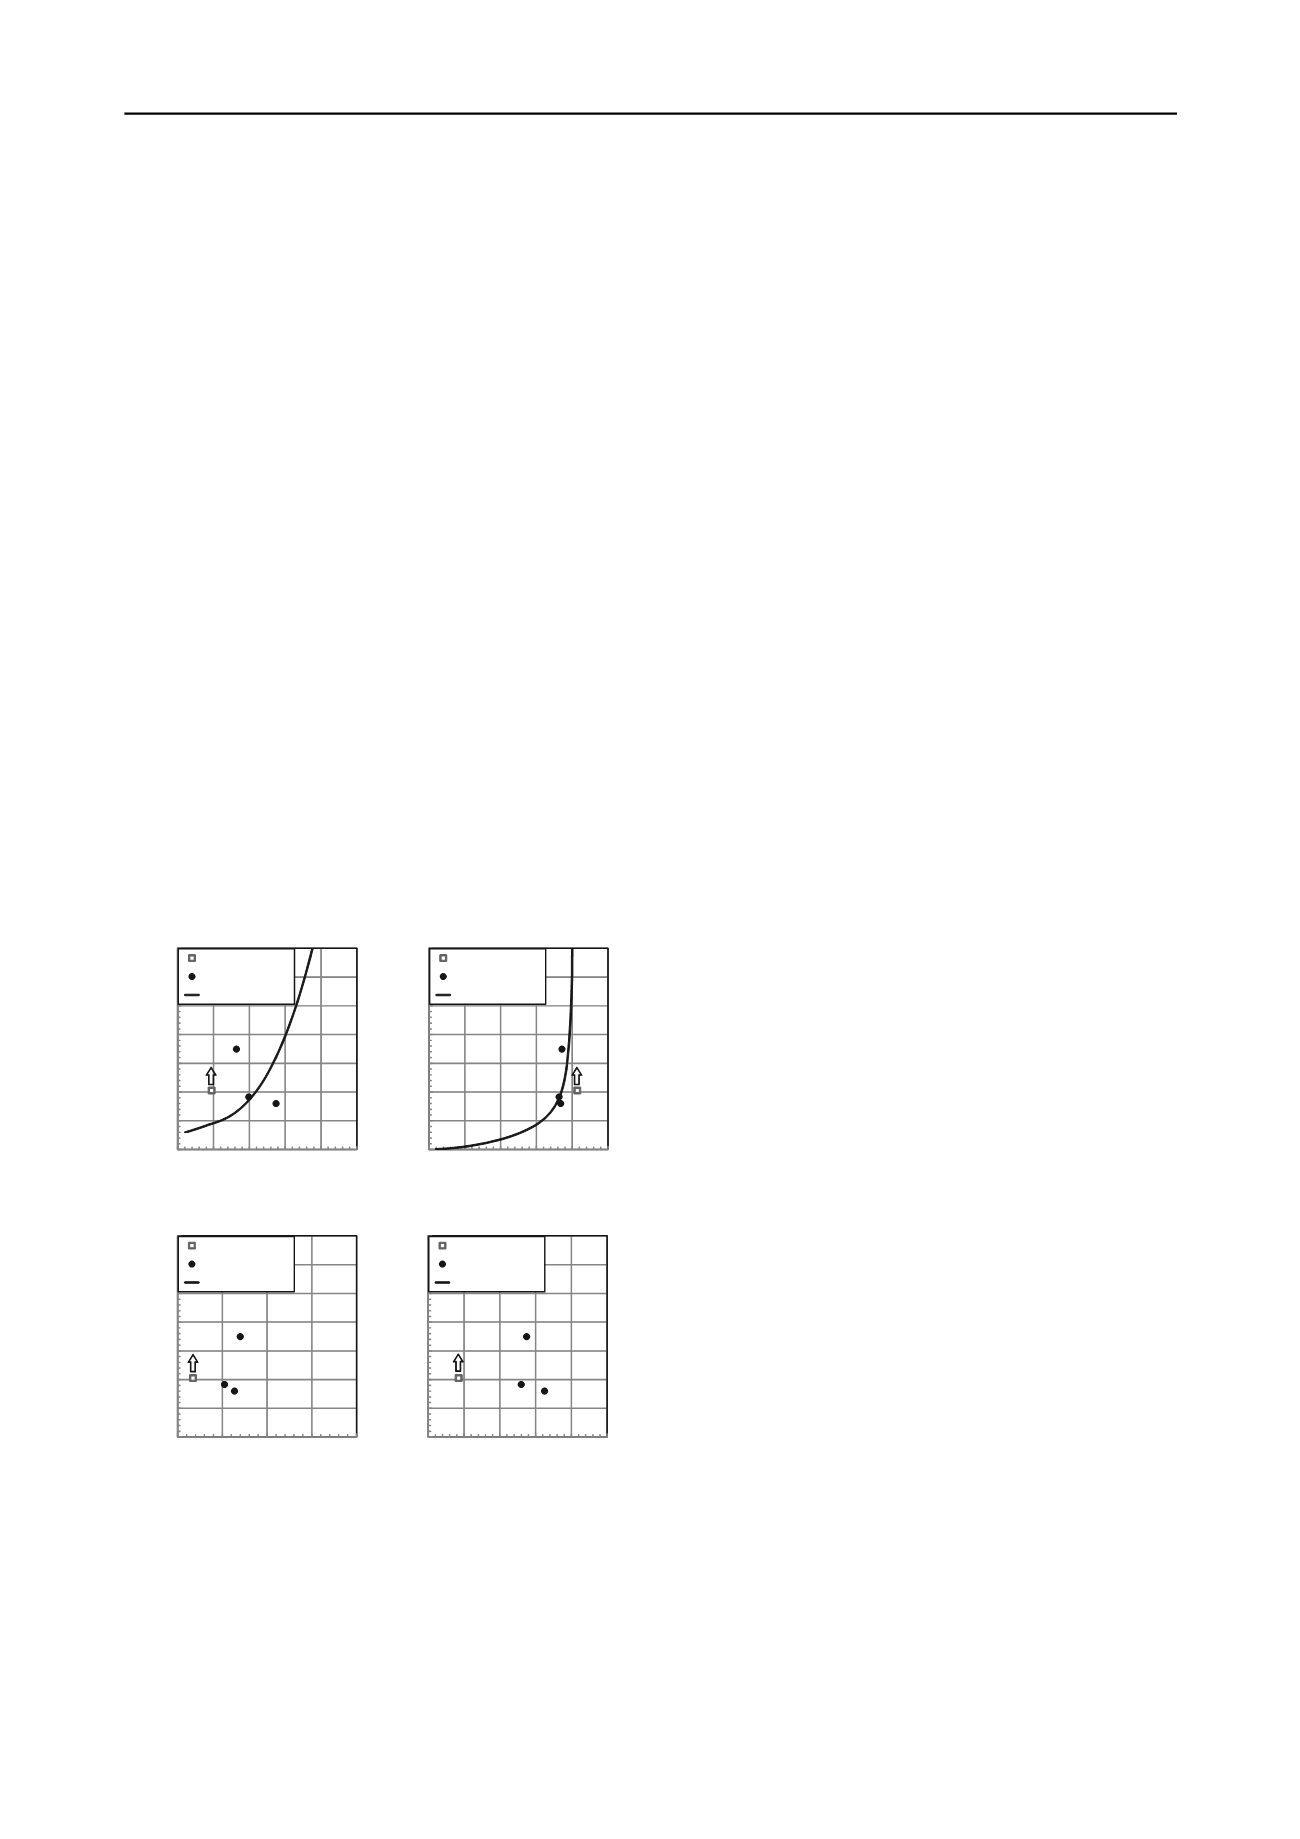
Figure 5 shows the plot of the (
CRR
)
triaxial
vs (
CRR
)
field
estimated from the following empirical formulas: (a) from
normalized CPT tip resistance,
Q
tn
,
cs
(Robertson and Wride,
1998); (b) normalized shear wave velocity
V
S
1
(Andrus and
Stokoe, 2000); (c) dilatometer modulus,
E
D
(Tsai et al. 2009);
and (d) horizontal stress index,
k
d
(Tsai et al. 2009). Note that
for Carr Rd specimen, only
DA
=2% was achieved in the tests
and therefore, (
CRR
)
triaxial
should be higher than the value
measured, as indicated by the arrow sign in the figure. It can be
seen that penetration-based methods (CPT and DMT) do not
correlate well with the laboratory-obtained cyclic resistance. It
is hypothesized that the shear stresses during penetration were
so severe that particle breakage formed new finer grained
materials, the mechanical properties of which were very
different from the original pumice sand. On the other hand,
empirical method based on shear wave velocity seemed to
produce good correlation with liquefaction resistance of
pumiceous soils. Although the
V
s
in this research was obtained
from SDMT where the penetrating rod may have induced
particle breakage in the adjacent zone, the shear waves travelled
through the intact grains and not on the crushed ones.
(2) As the confining pressure was increased, the liquefaction
resistance curve of reconstituted pumice specimens was
shifted downward and the resistance reduced, consistent
with the observations made on hard-grained sands.
(3) During the initial stage of shearing, the increase in surface
area (as a result of particle crushing ) was small; however,
as the liquefaction stage was reached, the surface area
increased remarkably because large strains occurred with
associated translation and rotation of particles causing the
higher degree of crushing.
(4) Among the in-situ methods tested, the empirical method
based on shear wave velocity seemed to produce good
correlation with liquefaction resistance of pumiceous soils.
ACKNOWLEDGEMENTS
The study presented in this paper was part of a research work
supported by the New Zealand Earthquake Commission (EQC)
under grant number 10/589. the authors would also like to
thank Dr Andy Tai and Mr. Yi Lu of the University of
Auckland for the assistance in performing the experimental
works presented herein and Mr Andy O’Sullivan of Hiway
Geotechnical Ltd and Mr. Graham Blakeley of Aecom for the
in-situ sampling and boring information at the Waikato sites.
It should be mentioned that only 4 tests were performed in
this study, and more tests are required to validate this
observation. Detailed studies on the percentage of pumice in the
soil specimens may also be warranted.
REFERENCES
Andrus, R.D. & Stokoe, K.H., II. 2000. Liquefaction resistance of soils
from shear-wave velocity.
J. Geotech. Geoenv. Engrg., ASCE
,
126(11), 1015-1025.
Boulanger, R.W & Idriss, I.M. 2004. State normalization of penetration
resistances and the effect of overburden stress on liquefaction
resistance.
Proc., 11th Int Conf on Soil Dynamics and Earthquake
Engineering and 3rd Int Conf on Earthquake Geotechnical
Engineering
, Vol. 2, 484-491.
Miura, N. & Yamanouchi, T. 1971. Drained shear characteristics of
Toyoura sand under high confining stress,
Proc. of Japanese
Society of Civil Engineers
, 260: 69-79 (in Japanese).
New Zealand Standard 1986.
NZS 4402 : 1986 - Methods of Testing
Soils for Civil Engineering Purposes
. Part 2 Soil classification tests.
2.7 Determination of the solid density of soil particles. Test 2.7.2
Method for medium and fine soils.
Orense, R.P., Kiyota, T., Yamada, S., Cubrinovski, M., Hosono, Y.,
Okamura, M. & Yasuda, S. 2011. Comparison of liquefaction
features observed during the 2010 and 2011 Canterbury
earthquakes.
Seismological Research Letters
, 82 (6), 905-918.
Orense, R.P., Pender, M.J. and Tai, A. 2012. Undrained cyclic shear
behaviour of pumice sand,
Proc., Australia-New Zealand
Conference on Geomechanics
, 6pp.
Robertson, P.K. & Wride, C.E. 1998. Evaluating cyclic liquefaction
potential using the cone penetration test.
Canadian Geotechnical
Journal
, 35(3), 442-459.
0.0
0.1
0.2
0.3
0.4
0.5
0.6
0.7
0 50 100 150 200 250
C
yclic
R
esistace
R
atio,C
R
R
Q
tn,cs
Carrs Rd site
Mikkelsen Rd site
Empirical formula
0.0
0.1
0.2
0.3
0.4
0.5
0.6
0.7
0 50 100 150 200 250
C
yclic
R
esistace
R
atio,C
R
R
V
s1
Carrs Rd site
Mikkelsen Rd site
Empirical formula
(a) CPT (b) V
s
0.0
0.1
0.2
0.3
0.4
0.5
0.6
0.7
0
25
50
75 100
0.0
0.1
0.2
0.3
0.4
0.5
0.6
0.7
0 2 4 6 8 1
C
yclic
R
esistace
R
atio,C
R
R
k
D
Rollins, K.M. & Seed, H. B. 1988. Influence of buildings on potential
liquefaction damage.
Journal of Geotechnical Engineering, ASCE
,
116, GT2, 165-185.
Tsai, P.H., Lee, D.H., Kung, G.T.C. & Juang, C.H. 2009. Simplified
DMT-based methods for evaluating liquefaction resistance of soils.
Engineering Geology
, Vol. 103, No. 102, 13-22.
Yamamoto, Y., Hyodo, M. & Orense, R. 2009. Liquefaction resistance
of sandy soils under partially drained condition.
Journal of
Geotechnical and Geoenvironmental Engineering
, ASCE, Vol. 135,
No. 8, 1032-1043.
C
yclic
R
esistace
R
atio,C
R
R
E
D
Carrs Rd site
Mikkelsen Rd site
Empirical formula
0
Carrs Rd site
Mikkelsen Rd site
Empirical formula
(c) DMT dilatometer modulus (d) DMT horizontal stress index
Figure 5: Comparison between laboratory obtained CRR and those from
field-derived parameters.


