1568
Proceedings of the 18
th
International Conference on Soil Mechanics and Geotechnical Engineering, Paris 2013
parameter.
L
N N
was termed cycle ratio. Booker et al. (1976)
proposed the following simplified alternative of the equation:
1/2
2
arcsin
u
L
N
r
N
(2)
Since the equations are identical in shape, both will be
termed Seed et al model in this paper. The Seed et al. model
requires definition of three parameters, which are
N
,
N
L
and
.
N
can be determined from the ground motion time history
calculated from a total stress site response analysis.
N
L
is most
often determined from simplified liquefaction approach.
Extensive tests have been performed to determine the bounds of
the pore pressure measurements expressed in terms of cycle
ratio and representative value of
. Lee and Albaisa (1974)
proposed upper and lower bounds, while Booker et al. (1976)
recommended
= 0.7 for clean sands. Polito et al. (2008), based
on 145 cyclic triaxial tests, proposed empirical equation for
.
While the shape of the Seed et al. model was shown to agree
well with the measured build-up of pore pressure, the model has
its limitations. The main drawback of the model is that since
N
and
N
L
have to be defined a priori, it cannot be used for a
coupled numerical analysis. Another limitation of the models is
that it cannot be used for non-liquefiable soils for which
N
L
cannot be defined.
This study proposes the following modified equation, which
is based on the model of Seed et al.:
1/2
1.0
2
arcsin
u
u
r
dD
dr
D
)
(3)
where,
= incremental residual pore pressure ratio,
D
=
damage parameter,
D
ru
=1.0
is the value of damage parameter
D
at
initiation of liquefaction and
is an empirical constant. It
should be noted that
N
and
N
L
of Eq. (2) are replaced by the
damage parameters
D
and
D
ru
=1.0
, respectively. The damage
parameter, which is essentially a variable which contains
parameters that define the strain / stress history and can
uniquely relate to build-up of pore pressure for a given soil, is
defined as follows:
u
dr
(
t
D SR CSR
(4)
where, where
SR
= shear stress ratio (shear stress normalized to
initial effective vertical stress),
CSR
t
= threshold shear stress
ratio below which residual pore pressure is not generated,
=
length of shear stress path,
= calibration parameter. The
equation for the damage parameter is very similar to the
function proposed by Ivsic (2006). Two parameters for
D
,
which are
CSR
t
and
, should be selected from trial and error.
CSR
t
can be selected from visual inspection of the
CSR
– N
curve. The second parameter,
, is calculated by averaging. The
concept of the damage parameter implies that
D
at liquefaction
for a given soil, which will be termed
D
ru
=1.0
in this paper,
should be a constant independent of
SR
. Therefore,
D
ru
=1.0
of the
CSR – N
curve should be all identical. In reality, although the
values of
D
ru
=1.0
for different
CSR
s may be similar, but they will
not be identical. In other words, it might not be possible to
uniquely relate to the pore pressure using a single value of
for
all
SR
s. Through several trials, it was shown that the optimum
value of
can be calculated by averaging using the following
equation, which is derived from Eq.(4):
1
1
log
1
log
log
1
M
Avg
i
N i
N i
CSR CSR CSR CSR
t
i
t
i
M
(5)
where
M
= number of data points of
CSR
–
N
curve,
i
and
i
+1
denote two adjacent data points of the curve.
After the selection of the parameters, it is recommended that
the corresponding
CSR
–
N
curve be back-calculated and
compared to the target curve to confirm that the appropriateness
of the parameters. In back-calculation, one of the measured data
points is selected as the reference data point. The rest of the data
points for the back-calculated
CSR
–
N
curve are calculated
relative to the reference data point. The following equation can
be used to calculate
CSR
i
for a given
N
i
log
log
10
ref
i
ref
t
Avg
N
N
CSR CSR
i
t
CSR
CSR
(6)
where,
CSR
ref
= CSR
of the reference data,
N
ref
= number of
cycles of reference data. The full back-calculated
CSR
–
N
curve can be constructed by using Eq(4). for a range of
N
i
. This
CSR
t
and
selection process should be repeated until a best fit
CSR
–
N
curve is obtained.
The applicability of the recommended procedure for
selecting
CSR
t
and
is evaluated through comparison with
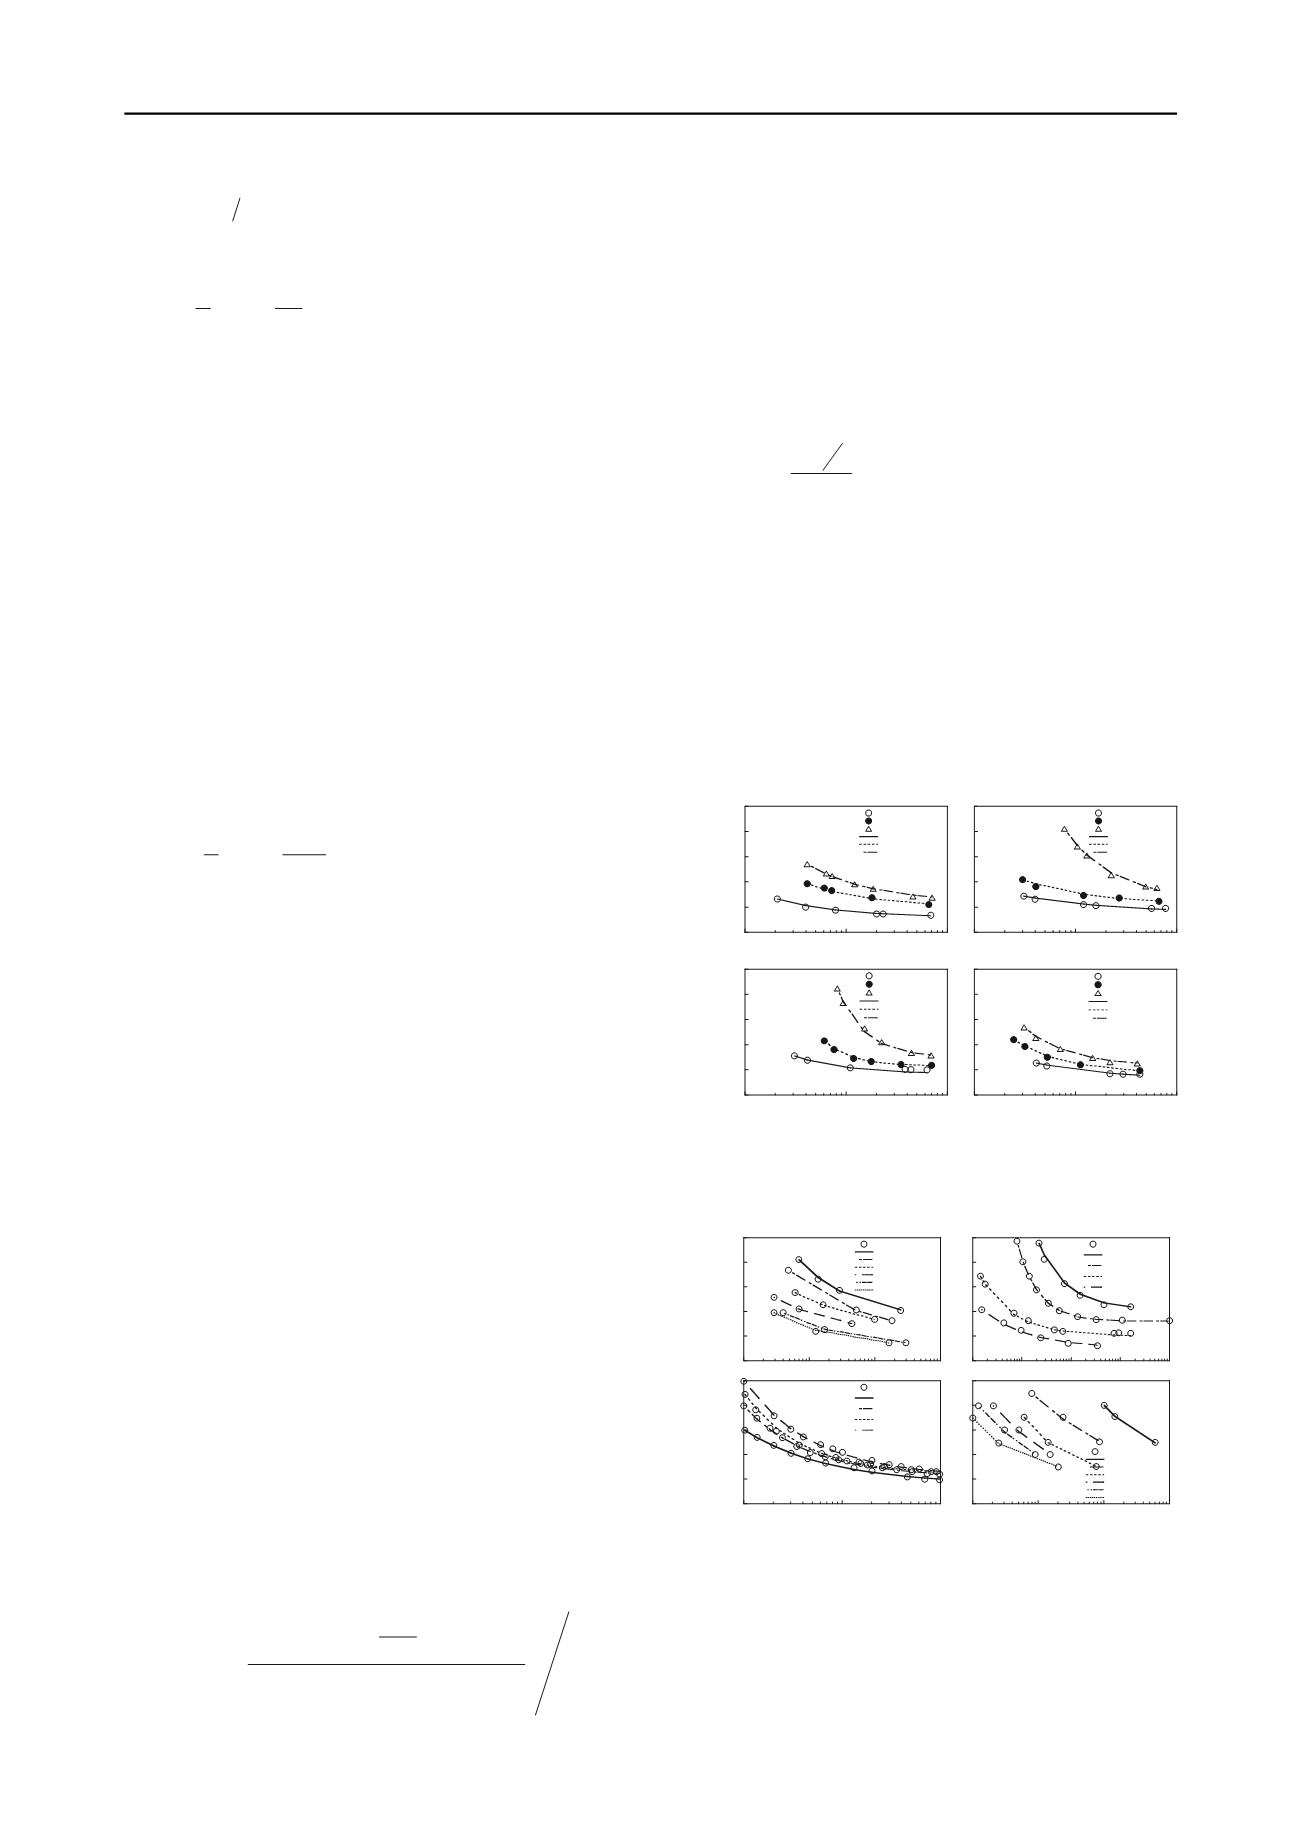
extensive sets of data. Figure 1 -
Figure 3
compare the predicted
CSR
–
N
curves with the published data. It is shown that the
recommended process provides good estimates of the
measurements for all cases, which encompass a wide range of
soils and densities.
0
0.2
0.4
0.6
0.8
1
1
10
100
Dr=40%
Dr=67%
Dr=77%
Calculated (Dr=40%)
Calculated (Dr=67%)
Calculated (Dr=77%)
Cyclic stress ratio, CSR
(a)
0
0.2
0.4
0.6
0.8
1
1
10
100
Dr=31%
Dr=53%
Dr=80%
Calculated (Dr=31%)
Calculated (Dr=53%)
Calculated (Dr=80%)
(b)
0
0.2
0.4
0.6
0.8
1
1
10
100
Dr=41%
Dr=58%
Dr=78%
Calculated (Dr=41%)
Calculated (Dr=58%)
Calculated (Dr=78%)
Cyclic stress ratio, CSR
Number of cycles, N
(c)
0
0.2
0.4
0.6
0.8
1
1
10
100
Dr=45%
Dr=65%
Dr=80%
Calculated (Dr=45%)
Calculated (Dr=65%)
Calculated (Dr=80%)
Number of cycles, N
(d)
Figure 1. Comparison of measured (Carraro et al. 2003) and predicted
CSR – N
curves: (a) Clean Ottawa sand, (b) Ottawa sand with 5% non-
plastic silt, (c) Ottawa sand with 10% non-plastic silt, (d) Ottawa sand
with 15% non-plastic silt.
0
0.1
0.2
0.3
0.4
0.5
1
10
100
1000
Measured
Calculated (FC=0%)
Calculated (FC=5%)
Calculated (FC=10%)
Calculated (FC=15%)
Calculated (FC=22%)
Calculated (FC=30%)
Cyclic stress ratio, CSR
(a)
0
0.1
0.2
0.3
0.4
0.5
1
10
100
1000
Measured
Calculated (FC=0%)
Calculated (FC=10%)
Calculated (FC=30%)
Calculated (FC=42%)
(b)
0
0.1
0.2
0.3
0.4
0.5
1
10
100
Measured
Calculated (Dr=50%)
Calculated (Dr=60%)
Calculated (Dr=68%)
Calculated (Dr=70%)
Cyclic stress ratio, CSR
Number of cycles, N
(c)
0
0.1
0.2
0.3
0.4
0.5
1
10
100
1000
Measured
Calculated (FC=0%)
Calculated (FC=5%)
Calculated (FC=13%)
Calculated (FC=20%)
Calculated (FC=45%)
Calculated (FC=60%)
Number of cycles, N
(d)
Figure 2. Comparison of measured and predicted
CSR – N
curves: (a)
Troncoso and Verdugo (1985), (b) Xenaki and Athanasopoulos (2003),
(c) (Park et al. 1999) , (d) Koester (1994).


