1577
Technical Committee 203 /
Comité technique 203
were performed under regulated vacuum confinment of about
95 kPa. A typical testing sequence was as follows:
1. Prepare sample by pluviating through tube into split
mold and membranes. Assemble remaining parts of device
while under vacuum, then remove inner and outer split
molds.
2. Perform low-amplitude RC (γ≈10
-4
%) versus time
(1,2,5,10,20 min...) to asses duration-of-confinement effects,
if any.
3. Perform TOSS uniform cyclic test at low amplitude
(τ=10 kPa) for 200 cycles of loading. Record and inspect
hysteresis loops.
4. Perform low amplitude RC to asses any changes to
G
max
due to TOSS loading.
5. Repeat (3),(4) by increasing TOSS stress level until
specimen fails or device reaches maximum displacement.
Usually steps of Δτ=10kPa were chosen.
For an irregular loading history, the same sequence was
followed where the absolute value of peak stress was gradually
increased for each stage.
3.2
Test Results
Preliminary tests have examined several behavior phenomena
discussed in the literature. Among the aims of these tests were
to shed light on several questions.
1. Can very different sorts of tests yield similar fundamental
properties, namely shear wave velocity? Results from many
tests have shown that the low amplitude shear wave velocity
measured from RC tests and bender element tests in a triaxial
cell are identical (Anka 2012).
2. How do TOSS and RC results compare vs. strain level?
The testing so far has shown that, in the strain range where both
are effective and accurate, they produce the same results. RC
tests can measure modulus as much lower strain levels than
TOSS. At very high strains, TOSS measurements of damping
are much easier to obtain, as resonance is difficult to maintain at
strains near failure. Since the TOSS device can be strain-
controlled, the operator may closely monitor behavior near
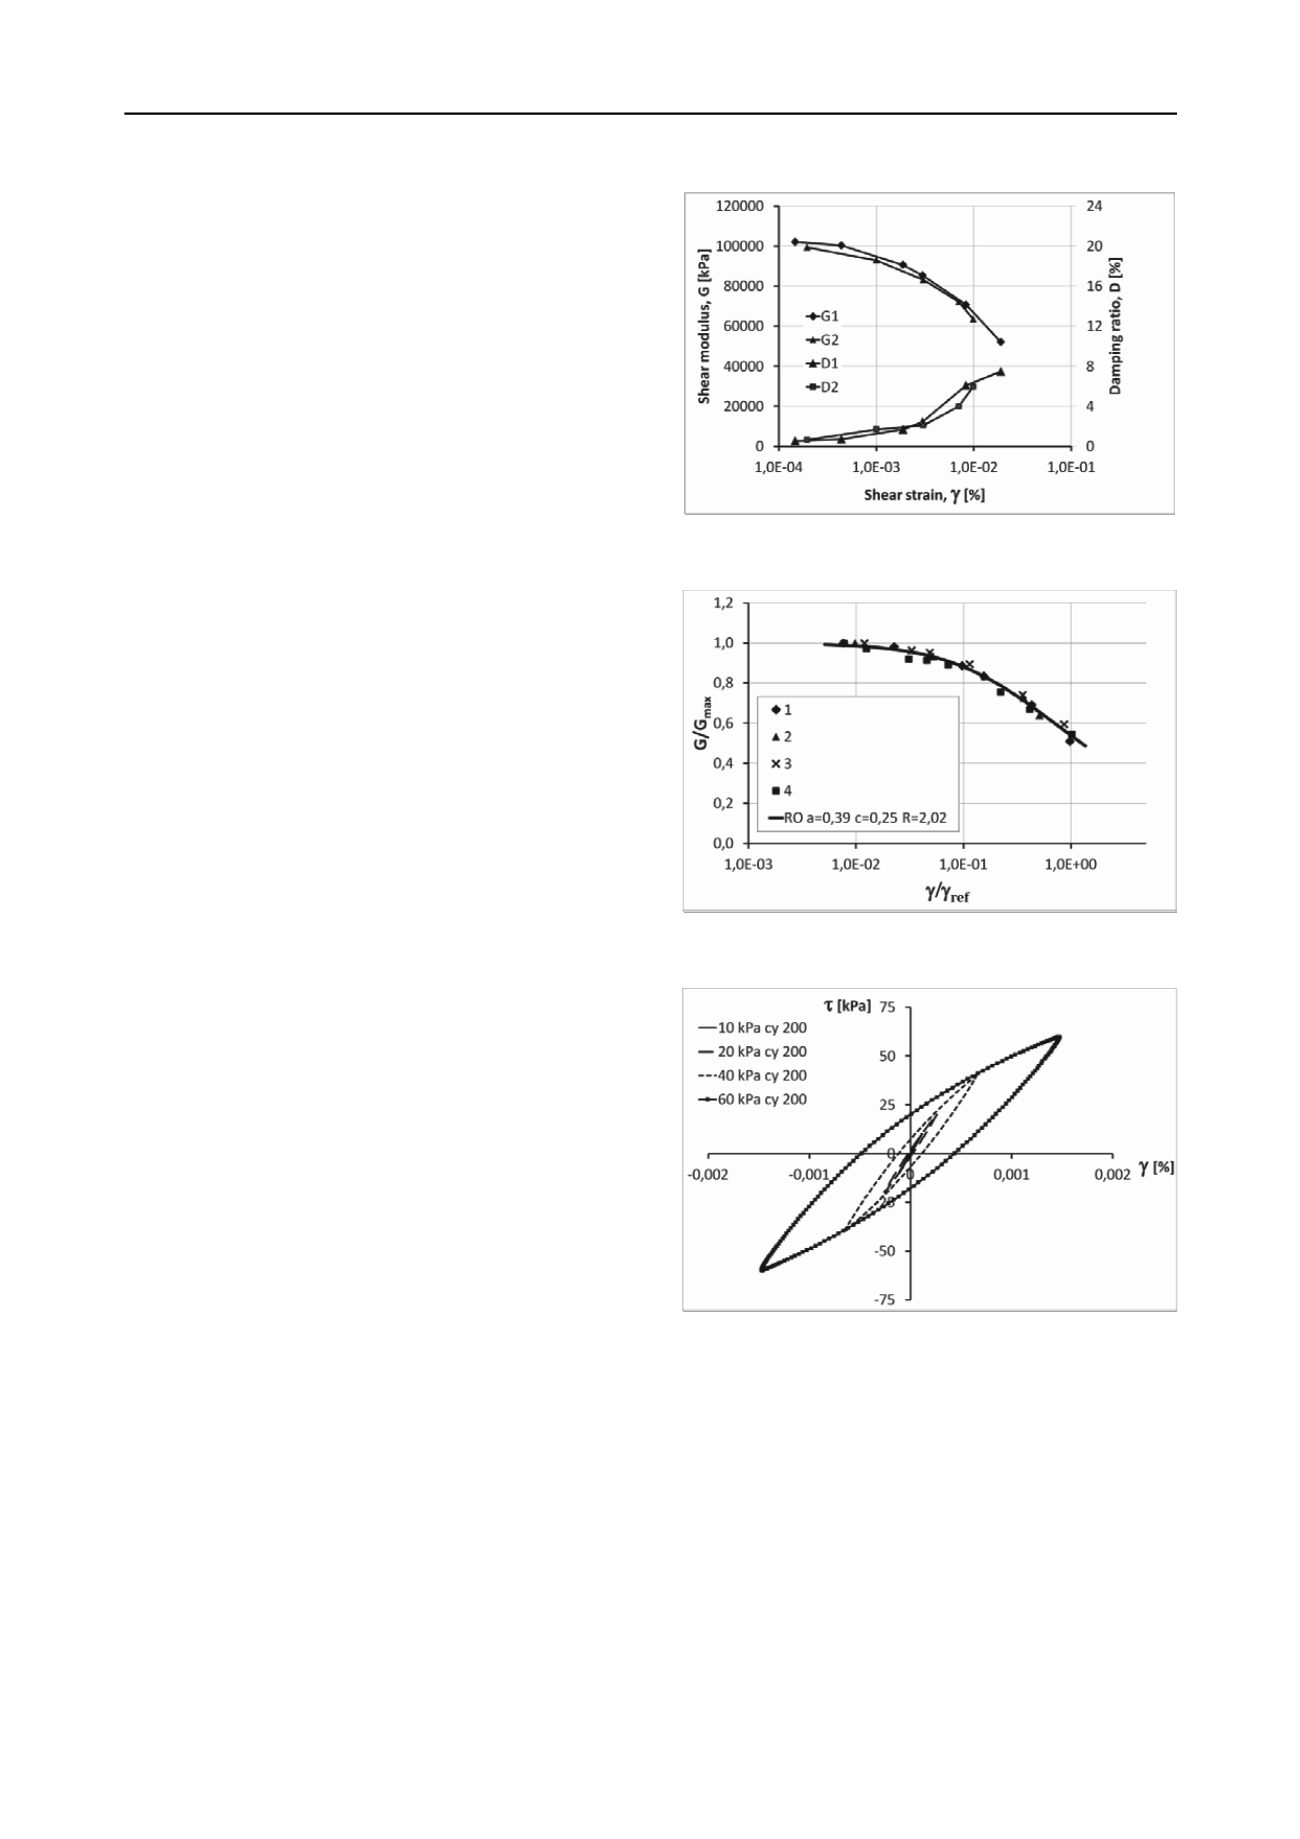
failure and avert collapse. Examples or RC test results are
shown in Figure 3 where two sets of modulus reduction and
damping sequences are shown. Data can be further processed to
include reference strain. The advantage of using a
dimensionless strain is that confinement effects are eliminated.
Shown in Figure 4 are four such tests where confining stresses
ranged from 50 to 200 kPa.
Results of a TOSS cyclic test are shown in Figure 5. Each
loop corresponds to a different peak shear stress level. Note the
changes in secant modulus as the strain levels increase.
Additionally hysteretic damping also increases with increasing
strain, indicated by the larger areas of the stress-strain loops.
3. Do number of loading cycles have an impact on stress-
strain behavior? For most of the testing performed so far, there
is a definite effect. However, the cyclic behavior tends to
stabilize after 100-200 cycles. Since these tests have been
performed on dry soil, no pore pressure behavior has been
examined yet. Figure 6 shows selected hysteresis loops of a
TOSS test performed for 200 load cycles. The soil is stiffening
with each cycle as shown by the more vertically inclined loops.
Damping is decreasing, evidenced by the narrowing of the loop
area.
Figure 3. Modulus reduction and damping for two RC tests on Danube
Sand.
Figure 4. Modulus reduction vs. dimensionless strain, Ramberg-Osgood
curve fitted to the test data.
Figure 5. TOSS results for four different stress levels. This is cycle no.
200 for each stage of the test.
4. Do irregular load histories behave as predicted by soil
models? This is a question that cannot be fully answered here
since discussion of soil models and cylic loading criteria is
rather complex. However, based on preliminary data, one can
predict behavior under arbitrary loading histories if the G/G
max
vs. γ curve is defined by RC or TOSS (or more typically, both)
test data. One irregular load history was used to “track” the
progress of the stress-strain curve across the initial backbone
curve of the test. Contrary to the theory according to Pyke
(1979) the stress strain curve does not follow the backbone
curve at the time of crossing. Several tests have been performed
and this particluar effect is yet to be seen.


