 
          1581
        
        
          Technical Committee 203 /


            Comité technique 203


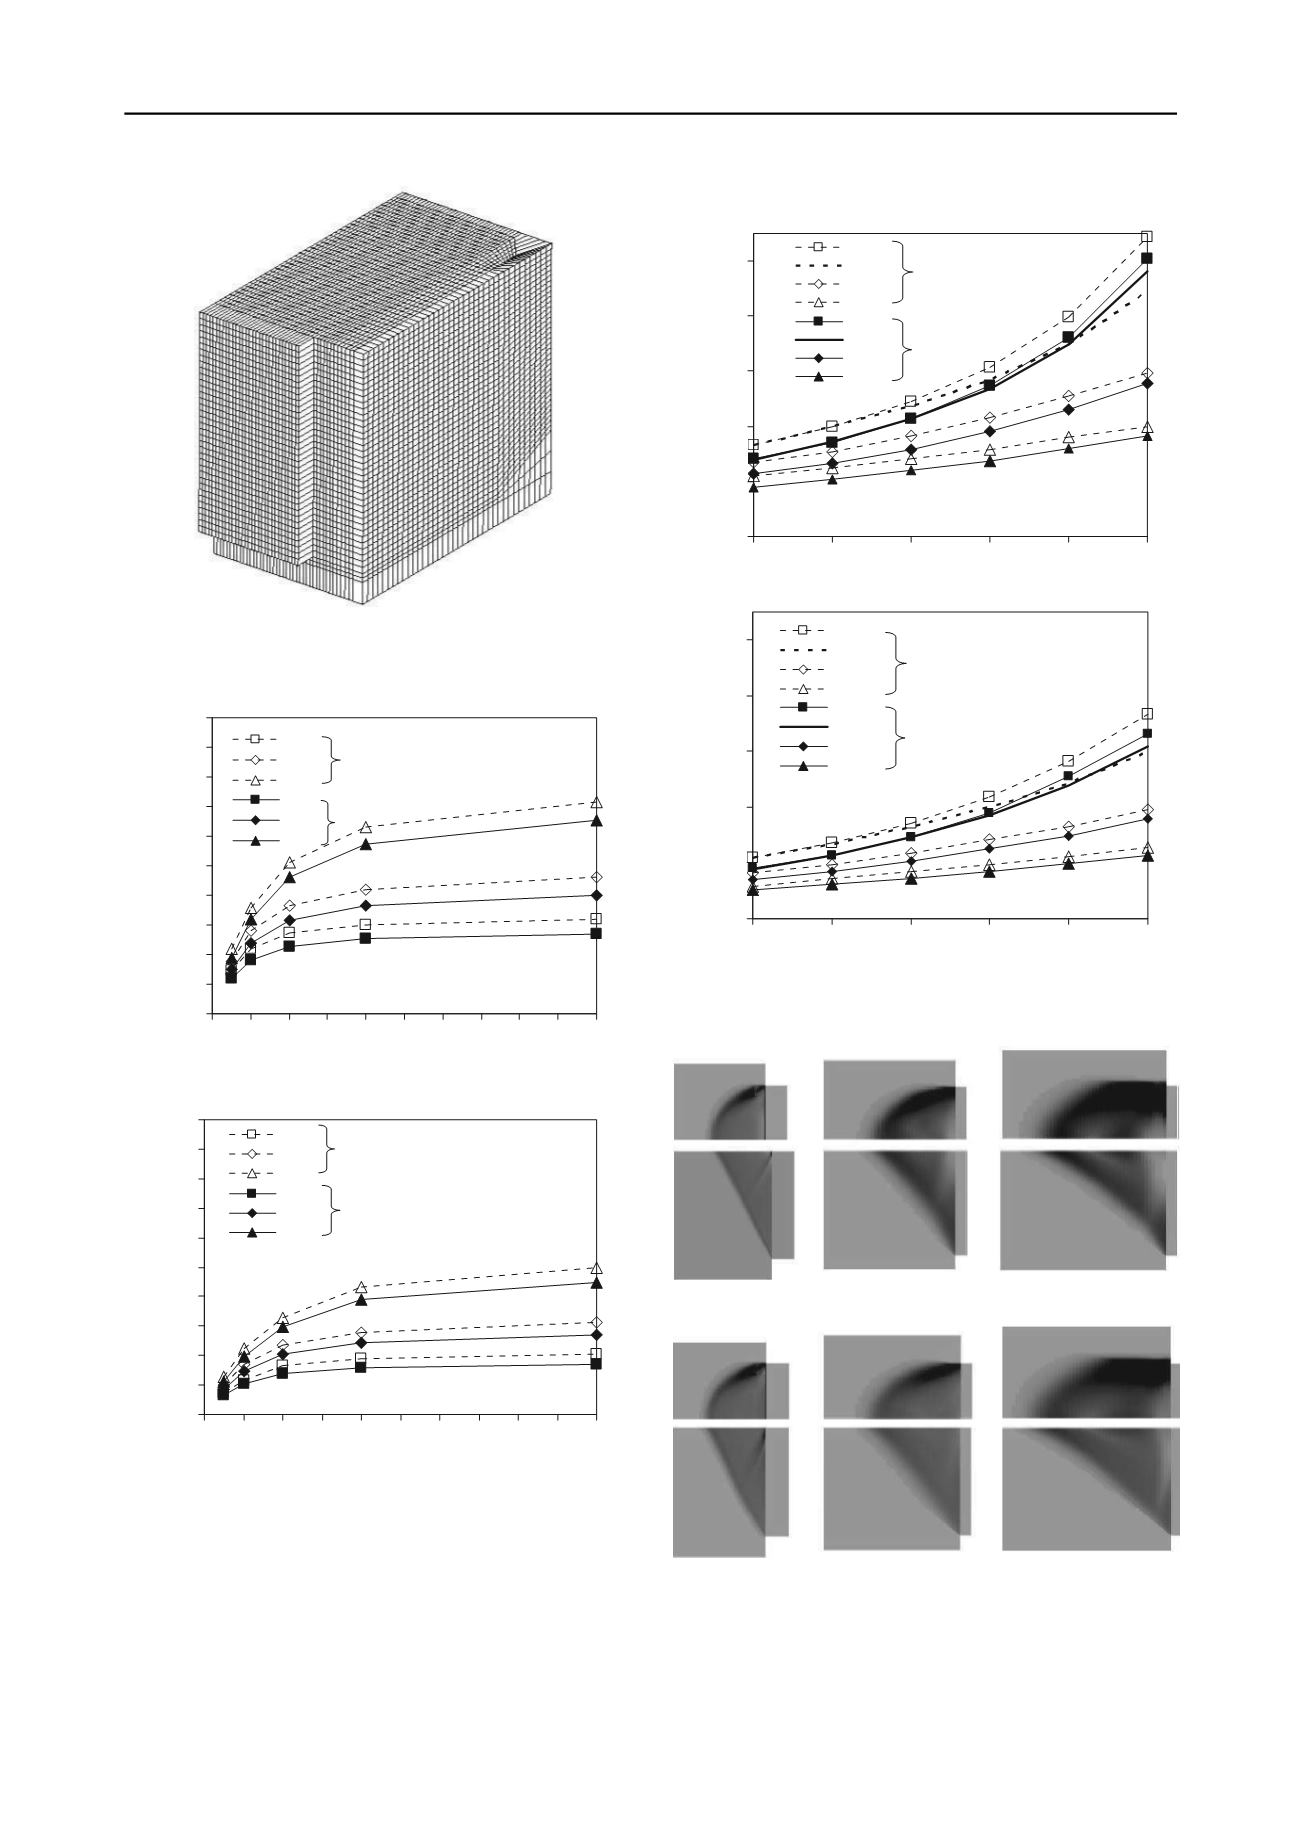
          Figure 2. Example of the finite element mesh used in the calculations
        
        
          for b/h=1 (each hexahedron represented in the figure is subdivided into
        
        
          24 tetrahedral elements).


          '


          º
        
        
          0
        
        
          0.1
        
        
          0.2
        
        
          0.3
        
        
          0.4
        
        
          0.5
        
        
          0.6
        
        
          0.7
        
        
          0.8
        
        
          0.9
        
        
          1
        
        
          0.0 0.5 1.0 1.5 2.0 2.5 3.0 3.5 4.0 4.5 5.0
        
        
          b/h
        
        
          K
        
        
          as


          h


          '=2/3


          '=0


          '


          º
        
        
          0
        
        
          0.1
        
        
          0.2
        
        
          0.3
        
        
          0.4
        
        
          0.5
        
        
          0.6
        
        
          0.7
        
        
          0.8
        
        
          0.9
        
        
          1
        
        
          0.0 0.5 1.0 1.5 2.0 2.5 3.0 3.5 4.0 4.5 5.0
        
        
          b/h
        
        
          K
        
        
          as


          h


          '=0


          '=2/3
        
        
          Figure 3. Values of the seismic horizontal active earth pressure
        
        
          coefficient, K
        
        
          as


          h
        
        
          , as a function of b/h.
        
        
          It can be observed that the volume of soil involved in the
        
        
          mechanisms is greater for the greater value of


          and that it is
        
        
          slightly greater for the greater friction ratio. It can also be seen
        
        
          that for


          ’=0 and


          =0 the mechanism (in the plane of
        
        
          symmetry) is almost planar, whereas the mechanism for


          ’=2/3 is curved and more complex, although not too far from
        
        
          planar.


          '


          º
        
        
          0
        
        
          0.2
        
        
          0.4
        
        
          0.6
        
        
          0.8
        
        
          1
        
        
          0.0
        
        
          0.1
        
        
          0.2
        
        
          0.3
        
        
          0.4
        
        
          0.5


          K
        
        
          as


          h
        
        
          2D
        
        
          2D M-O
        
        
          b/h=1
        
        
          b/h=0.5
        
        
          2D
        
        
          2D M-O
        
        
          b/h=1
        
        
          b/h=0.5


          '=0


          '=2/3


          '


          º
        
        
          0
        
        
          0.2
        
        
          0.4
        
        
          0.6
        
        
          0.8
        
        
          1
        
        
          0.0
        
        
          0.1
        
        
          0.2
        
        
          0.3
        
        
          0.4
        
        
          0.5


          K
        
        
          as


          h
        
        
          2D
        
        
          2DM-O
        
        
          b/h=1
        
        
          b/h=0.5
        
        
          2D
        
        
          2DM-O
        
        
          b/h=1
        
        
          b/h=0.5


          '=0


          '=2/3
        
        
          Figure 4. Values of the seismic horizontal active earth pressure
        
        
          coefficient, K
        
        
          as


          h
        
        
          , as a function of


          .


          '=0;


          =0


          '=0;


          =0.2


          '=0;


          =0.4


          '=2/3;


          =0


          '=2/3;


          =0.2


          '=2/3;


          =0.4


          Figure 5. Plastic deformation zones for


          ’=30º,


          ’=0 and 2/3, and
        
        
          three values of


          – 0, 0.2 and 0.4.
        
        
          Figure 6 presents the plan views of the plastic deformation
        
        
          zones for


          '=30º,


          '=2/3 and different b/h ratios and


          (for
        
        
          graphical reasons, the case


          =0 and b/h=5 is not shown). This
        
        
          figure allows understanding the three-dimensional effect of the