1589
Technical Committee 203 /
Comité technique 203
In this resonant column equipment, a fixed-free cylindrical
soil specimen is excited in two modes: torsion and flexure. The
resonant frequency and the damping ratio are obtained from the
analysis of the input excitation and the response of the specimen
in both time and frequency domains. The response of the
sample is measured at the driving plate and its shear wave
velocity is estimated by solving the equation of wave motion in
a prismatic rod (Khan et al. 2008).
4.
TEST RESULTS AND DISCUSSION
A complete description of the researches will be presented in
the PhD thesis (Gabryś 2013). However, the illustration of some
results will be given here as well. The shear modulus G is
determined from torional vibration, based on the measured
torsional resonant frequencies (f
0T
) and later calculated shear
wave velocity (V
S
). According to Richart et al. (1970) the
relationship between G and V
S
is formulated by the Eq. 1:
(1)
where
is the mass density.
The energy dissipated by the system is a measure of the
damping of the soil. Damping will be described by the rod
damping (D
L
) determined from longitudinal vibration and the
shear damping ratio (D
T
) defined from torsional vibration. Some
results of D
T
, derived in accordance with Eq. 2, will be shown
in this section.
(2)
where
is the viscous coefficient for torsional motion,
is the
circular resonant frequency, G is the shear modulus.
For torsional motion, using the standard GDS RCA drive
mechanism, the average shear strain amplitude (
) can be
calculated from:
(3)
where V is the accelerometer, R is the radius of sample, L is the
length of sample, f
0T
is the torsional resonant frequency.
The stiffness of the natural cohesive soils is influenced by
many various factors, among which essential are: strain
amplitude, density, void ratio or water content (when saturated
with water), effective stress, overconsolidation, time of
consolidation and prestraining (previous cyclic loading). Three
first elements have greater impact than others, but in this study
only one of them was investigated, mean effective stress (p’), as
mentioned in the introduction.
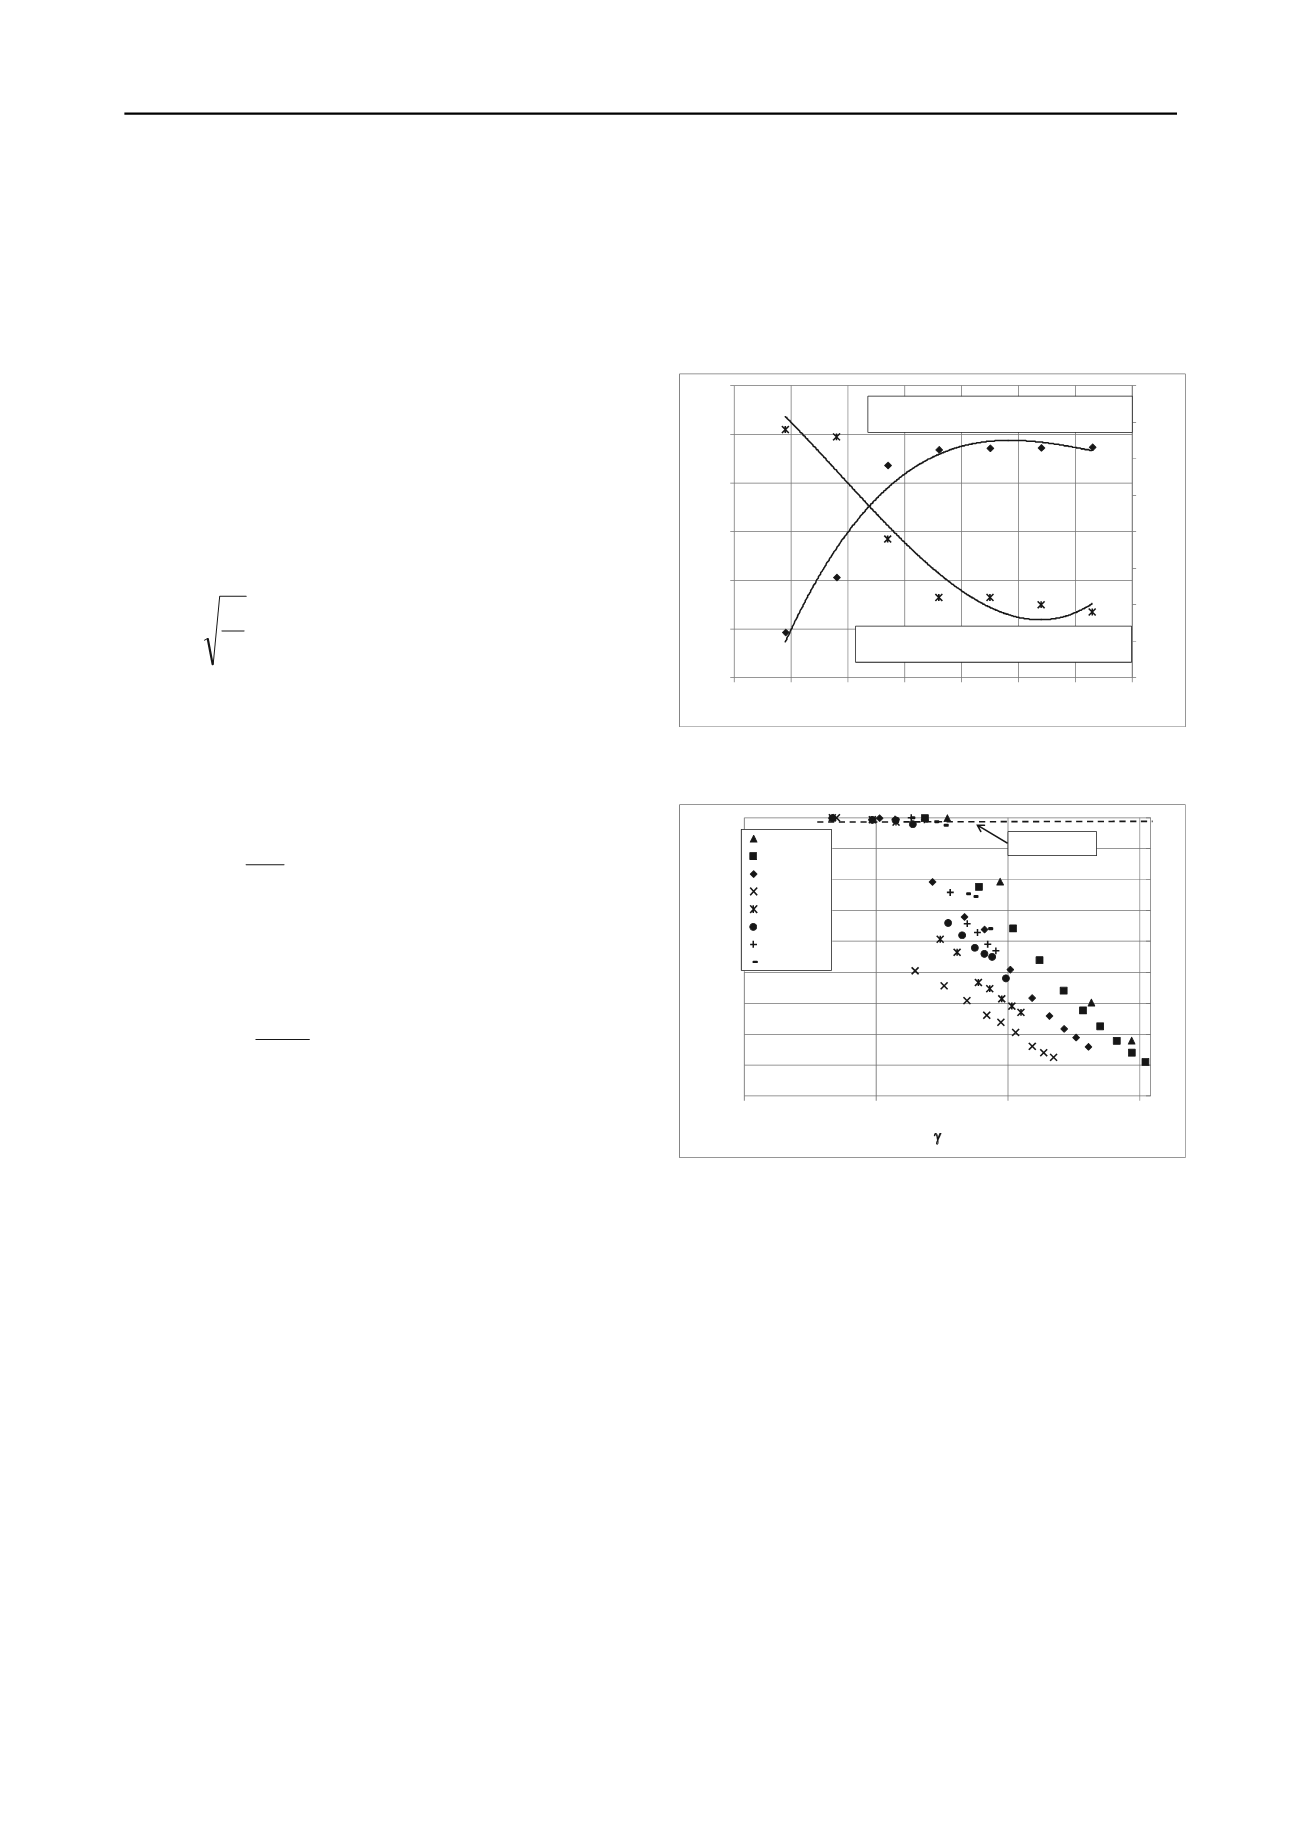
Figure 3 illustrates the influence of mean effective stress
(p’) on small strain shear modulus (G
0
) and shear damping ratio
(D
Tmin
) for Warsaw natural cohesive soil. The measurements
show that G
0
values increase with mean effective stress at the
third-degree polynomial function. The coefficient of
determination gives the quality of the function’s matching to the
data at 96%. The smallest value of G
0
, around 47MPa was noted
for p’ equal to 45kPa, the biggest one G
0
= 237MPa for
p’=315kPa. From this figure can be perceived as well that with
the mean effective stress at the level of 180kPa, no significant
changes in the value of G
0
are observed. The opposite trend of
variations applies to the relation between D
Tmin
and mean
effective stress (see Figure 3) with the coefficient of
determination of the third-degree polynomial function in the
range of 94%. The values of shear damping ratio decrease with
increasing mean effective stress, although these differences are
not very big. In this study, the decline in the value of D
Tmin
from
around 3,5% till 1,1% was noticed. As previously caught, there
is a limited value of p’ (around 180kPa) up to which the
reduction in D
Tmin
value is more evident.
Usually the shear modulus is normalized by normalized by
the small strain shear modulus (G/G
0
) to analyze the nonlinear
shear modulus properties versus shearing strain amplitude.
Figure 4 is an example of the normalized shear modulus versus
shearing strain amplitude for Warsaw cohesive soil. The typical
normalized shear modulus reduction curve is shifted to the right
higher position as increasing mean effective stress.
G
0
= 1E-05p'
3
-0,0117p'
2
+ 3,5455p'-100,13
R² = 0,9557
D
Tmin
= 2E-07p'
3
-5E-05p'
2
-0,0122p'+ 4,2143
R² = 0,9359
0,0
0,5
1,0
1,5
2,0
2,5
3,0
3,5
4,0
0
50
100
150
200
250
300
0
50
100 150 200 250 300 350
D
Tmin
[%]
G
0
[MPa]
p' [kPa]
Figure 3. Relation between small strain shear modulus and shear
damping ratio with mean effective stress for Warsaw natural cohesive
soil.
Figure 4. Effect of mean effective stress on normalized shear modulus
reduction curve for Warsaw natural cohesive soil.
Figure 5 presents the degradation of shear modulus (G) with
shearing strain amplitude (
) for examined samples under
different mean effective stresses. Strong non-linearity and
dependence on stress level is evidence. At small strain (<10
-5
), a
stress-strain loop is reduced to a nearly straight line: and elastic
behaviour. The secant modulus of G decreases as the strain
amplitude increases. The decline of G oscillates between the
values 230MPa and even 30MPa, depending on the test
conditions, namely on the mean effective stress (p’). Shear
strain (
) varies from the value around 5E-04% till 9E-02%, as
well as a function of p’. The first measurement of resonant
frequency and thus the small strain shear modulus was made
immediately after saturation and before consolidation phase of
the soil; is called here simply “saturation”. The results got from
this stage of the studies are the smallest, then gradually increase
together with the raise of the mean effective stress, up to the
largest values for p’=315kPa.
As shown in Figure 4, the normalized shear modulus
decreases as the strain amplitude increases. Therefore, it can be
concluded that the effect of shear strain amplitude (
) on the
normalized shear modulus (G/G
0
) is significant, but for the
<10
-5
there is no apparent difference between the values of
G/G
0.
G V
S
0,1
0,2
0,3
0,4
0,5
0,6
0,7
0,8
0,9
1,0
1,0E-06
1,0E-05
1,0E-04
1,0E-03
G/G
0
[-]
[-]
saturation
p'=45kPa
p'=90kPa
p'=135kPa
p'=180kPa
p'=225kPa
p'=270kPa
p'=315kPa
G/G
0
=0.99
G
D
T
5,0
L f
VR
T
0
596 .4


