3338
Proceedings of the 18
th
International Conference on Soil Mechanics and Geotechnical Engineering, Paris 2013
hydro-thermal coupling under the test conditions can be
adequately captured.
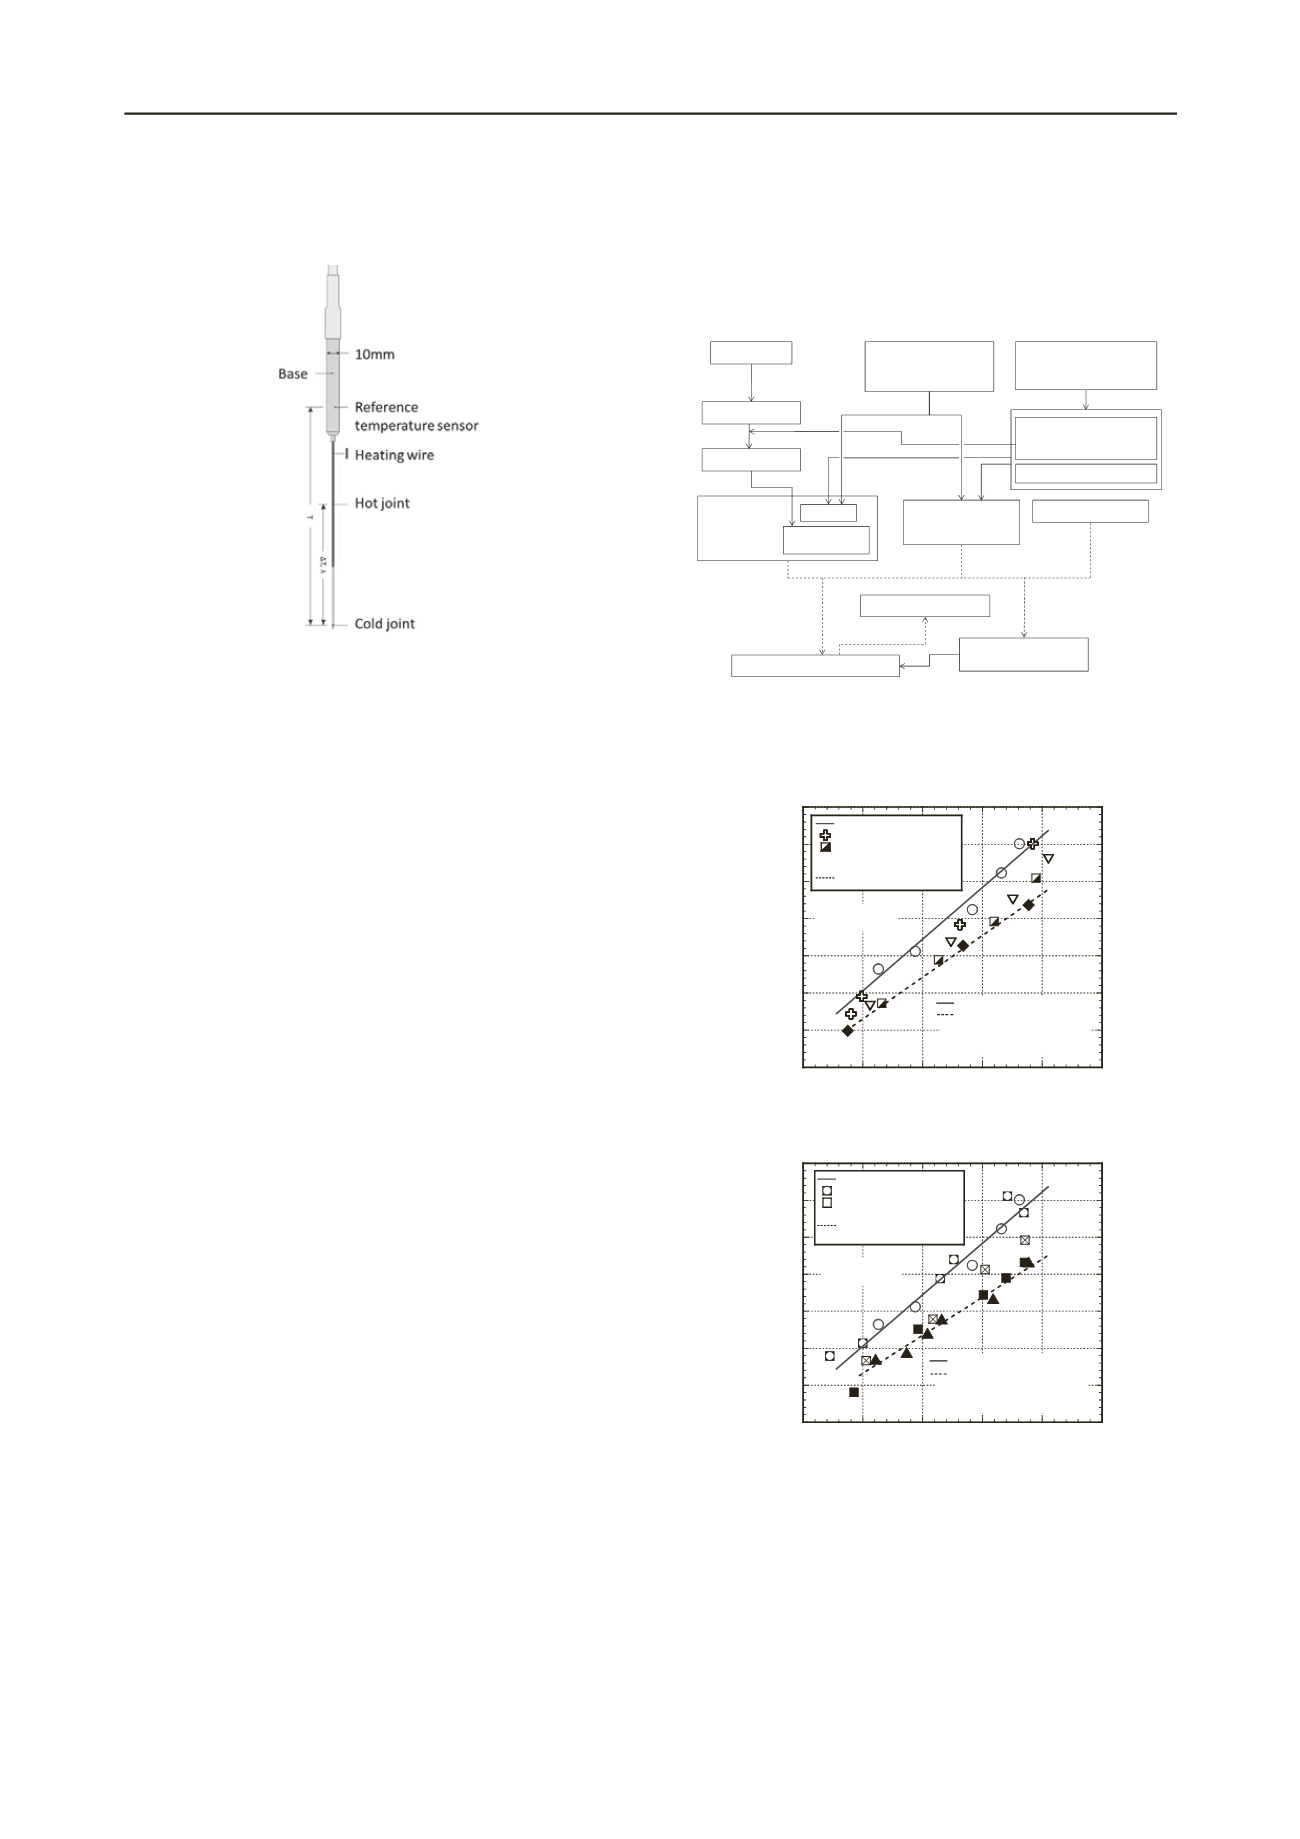
Figure 7. Needle probe for thermal conductivity measurement (Figure
1of Low et al.).
Nishimura et al. presented a multi-scale study in which a
local-scale THM analysis of soil was connected to regional-
scale geothermal analyses based on regional climatic prediction
data, which was, in turn, obtained from the atmosphere ocean
general circulation models (AOGCM) after applying statistical
and locally informed down-scaling techniques. The purpose of
the study was to develop an analytical framework for predicting
soil-structure response to climate change in the cold regions.
The main intent was to provide broad-scale predictions of
geothermal responses at a regional scale that offer hazard
zoning schemes related to permafrost thawing. The work will
allow engineers to design infrastructure with better resistance to
permafrost induced distress. The framework places climate
prediction at the highest global level, and applies AOGCM data
that is downscaled and calibrated against local climate datasets.
The next (middle) level (Figure 8) combines engineering
geology with nonlinear, one-dimensional thermal conduction
finite element modeling to generate extensive analytical
databases from which regional geocryological maps can be
created that provide information on both hazard mapping and
strategic planning of infrastructure. The lowest level of analysis
includes soil-structure interaction modeling using a new THM
constitutive model to help predict the complex soil-structure
interactions expected as a consequence of temperature-change
induced permafrost warming and degradation. The analysis
approach and THM models were checked against regional
geothermal maps in Eastern Siberia and against field tests on
chilled pipelines in Calgary, Canada, and both the checks
confirmed the predictions to be realistic.
Komine investigated the variations of swelling pressure and
deformation of bentonites, sodium-type bentonite A, (Kunigel-
V1) and calcium-type Bentonite C (Kunibond), that are
produced in Japan and contain 57% and 80% montmorillonite,
respectively. Bentonite is used as buffers for disposal of high-
level radioactive wastes because its high swelling behavior
helps in sealing wastes. However, the swelling characteristics of
bentonite degrade because of the decay-heat from the
radioactive wastes. Komine subjected the bentonite samples to
different temperatures over different periods of time and then
performed swell tests on the samples. The swelling pressure and
strains were investigated as functions of the initial dry density
and vertical stress and it was observed that the thermal effect on
swelling deformation characteristics of sodium-type bentonite A
is dependent on the vertical stress condition and that the
swelling deformation characteristics of calcium-type bentonite
C are markedly reduced by thermal exposure at vertical stress of
1000 kPa and by heating temperatures greater than 90°C for all
heating durations (see, for example, Figure 9). Komine also
performed chemical analyses such as measurement of cation
concentration of water around the bentonite specimens,
methylene blue absorption test, and X-ray powder method on
the bentonite samples to study how the different cations
influence the thermal behavior of the bentonites.
AOGCMs
Local Climate
Local Climate
Surface
boundary
conditions
Geological maps
Field reconnaissance
Satellite images
Remote Sensing
Construction ofDEM
Vegetationcharacteristics
Stratigraphy
(Porosity,watercontent,
freezing function,etc.)
Geothermal flux
-Ensemblemean
-ERA-40scheme
Elevation
-DEM
(Elevation,slopeangle,
slopeaspect, etc.)
-Vegetationcharacteristics
Geothermal Database
1-D FEM
Parametricanalyses
Query
Geothermal map
-n
t
-factor
-Air temperature
-Snowcover
Return
(Conditionsetting)
Figure 8. Structure of middle-level analysis to obtain local geothermal
predictions based on climate predictions and local geography (Figure 2
of Nishimura et al.).
0
5
10
15
20
25
30
35
1.2 1.3 1.4 1.5 1.6 1.
Maximum swelling strain,
smax
(%)
Initial dry density,
d0
(Mg/m
3
)
7
v
=1000kPa
○
: No heating
: 60 degree, 28 days
: 90 degree, 28 days
▽
: 110 degree, 28 days
◆
: 130 degree, 28 days
: y=69.714x-80.407
: y=56.325x-66.728
y : Maximum swelling strain (%)
x : Initial dry density (Mg/m
3
)
(a) Heating duration 28 days
0
5
10
15
20
25
30
35
1.2 1.3 1.4 1.5 1.6 1.
Maximum swelling strain,
smax
(%)
Initial dry density,
d0
(Mg/m
3
)
7
v
=1000kPa
: y=69.714x-80.407
: y=51.196x-59.911
y : Maximum swelling strain (%)
x : Initial dry density (Mg/m
3
)
○
: No heating
:
60 degree, 120 days
: 90 degree, 120 days
■
: 130 degree, 120 days
▲
: 130 degree, 365 days
×
(b) Heating duration 120 days and 365 days
Figure 9. Relation between maximum swelling strain and initial dry
density of calcium-type bentonite C at vertical stress of 1000 kPa
(Figure 5 of Komine).
2.2 Geothermal energy
This sub-section includes the papers that deal with thermal
energy extraction and storage. Out of the ten papers summarized
here, four papers deal with different ground heat exchanger
systems, five papers deal with geothermal piles, and one paper
deals with thermal energy storage.


