3330
Proceedings of the 18
th
International Conference on Soil Mechanics and Geotechnical Engineering, Paris 2013
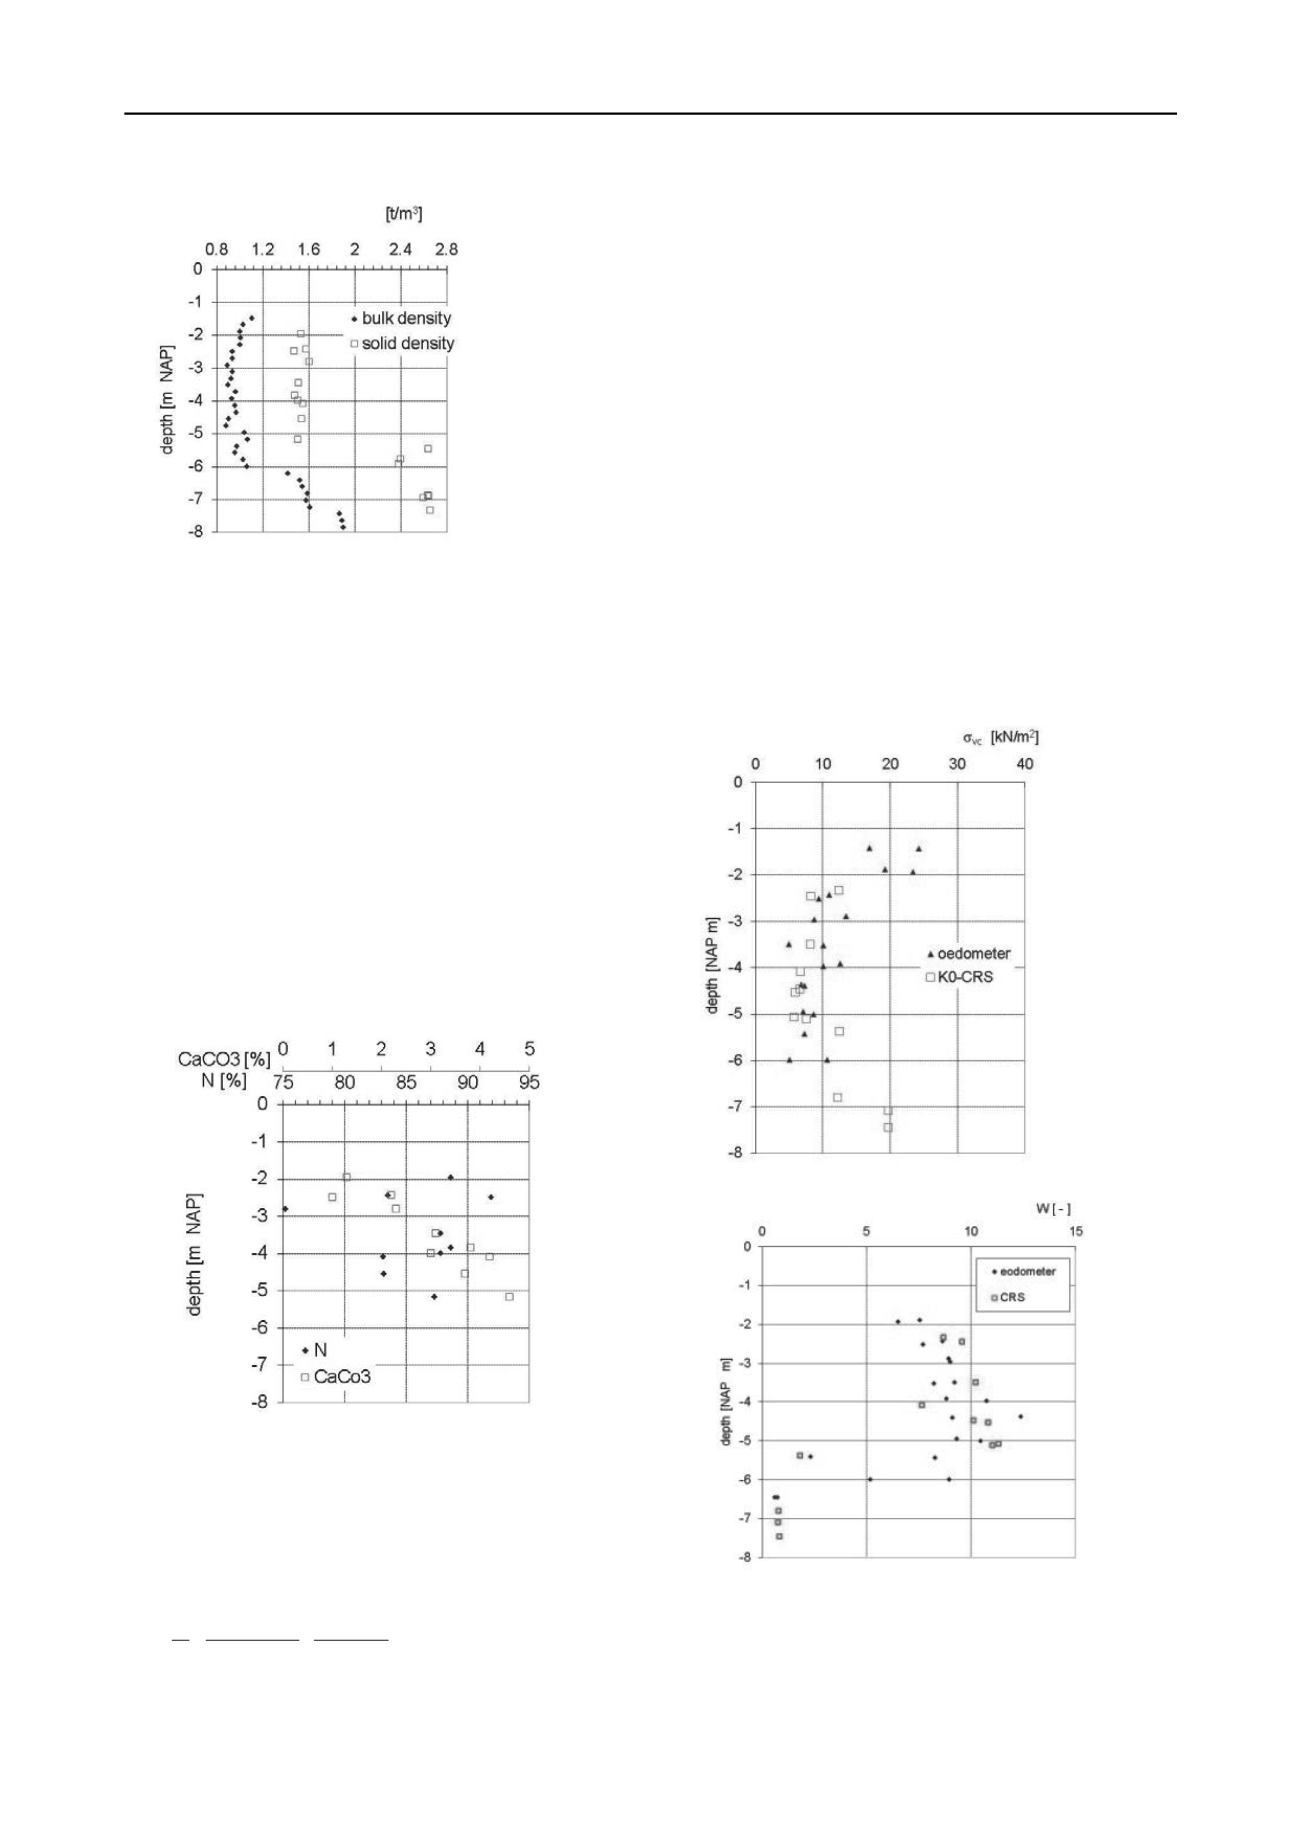
Figure 2. Bulk density and solid density, transition between peat and
clay is found at NAP -5.5 m
.
The peat layer is characterized as mainly sedge- reed peat.
According to the von Post classification it is described as H2-
H3, which means that the peat is only slightly decomposed.
Figures 2, 3 and 4 give geotechnical characterisations of the
peat layer.
Figure 2 shows the bulk density
and solid density
s
. For
the peat samples
= 0.98
0.08 t/m
3
, while for the clay layer
the bulk density increases to
= 1.8 t/m
3
at a depth of NAP -8.5
m. Note that the peat bulk density is close to or even lower then
the density of water. This can be explained by the large water
content, the possible presence of gas in the peat samples and
problems with re-saturating large pores in the laboratory before
the bulk density measurement. The density of the solid particles,
s
i found by pycnometer measurements. The measu
s
at
rements on
pe sa
3
ples is
found
at a
the peat
layer
f 75
to 90 %
N = 85.7 %, showing the high
s
fol
re-consolidation stress at the top and
low
ge of NAP -2.4 m to NAP -4.0
m is 10.0 kN/m , with a maximum value of 13.4 kN/m
2
and a
mi
mples give
s
= 1,52
0.04 t/m while for clay sam
s
= 2.56
0.12 t/m
3
. The increase in bulk density
depth of NAP -5.5 m gives a clear separation between
above NAP -5.5 m and the clay layers below.
Figure 3. Loss on ignition, N and CaCO
3
content in peat layer
igure 3 shows the loss on ignition N to be in the range o
F
with an average value of
organic nature of the peat.
To check the validity of the data,
is calculated form N
lowing the relation given by Skempton & Petley (1970):
(1)
Equation (1) gives for N = 0.857 [-],
s
= 1.51 [t/m
3
] which
is in good agreement with the measurements,
s
= 1.52
0.04
[t/m
3
].
Samples from two borings were selected at 0.5 m depth
interval for oedometer teststing, provide a profile of the pre-
consolidation stress and water content with depth. Besides the
series of oedometer tests a number of constant rate of strain
tests, so-called CRS-tests are conducted. Figure 4 shows the
pre-consolidation stress found by the oedometer and CRS tests.
For the oedometer tests, the pre-consolidation stress is derived
according to Becker (1987), for the CRS tests the procedure
according to Den Haan (2007) is applied. The profile, presented
in Figure 4, shows relatively high pre-consolidation stresses in
the top layer, followed by lower values in the peat layer and
organic clay layer. In the non-organic clay layer the pre-
consolidation stress is larger than in the peat layer. There is a
clear difference in the p
er part of the peat layer. For the oedometer tests the average
pre consolidation stress in the ran
2
nimum value of 4.9 kN/m
2
. For the lower part an average
value of 7.5 kN/m
2
is found with a maximum value of 10.6
kN/m
2
and a minimum value of 5.0 kN/m
2
.
The same trend is
found for the CRS tests.
Figure 4. Oedometer and CRS test results, top: pre-consolidation
stress, bottom: initial water content.
Figure 4 shows the profile of water content, defined as the
mass of the pore fluid divided by the solid mass, with depth.
The water content is measured before the execution of the
oedometer and CRS tests. Note that the water content is given in
1 1.04 1 1.04 1
1
N
N
1.4
2.7
s


