 
          3322
        
        
          Proceedings of the 18
        
        
          th
        
        
          International Conference on Soil Mechanics and Geotechnical Engineering, Paris 2013
        
        
          dilatants and, consequently, their use represents a significant
        
        
          risk.In reply to this claim, Perry (1991) says that the highly
        
        
          erosive nature of the loess is well known. Accordingly, to avoid
        
        
          the dam core piping formed by silty soil, it requires the
        
        
          placement of an appropriate filter downstream. Thus Ririe Dam,
        
        
          built 35 kilometers of Teton Dam, has built a loess core and
        
        
          designed the appropriate filters, showing satisfactory
        
        
          performance.
        
        
          In Argentina, loessial silts have been used in several dams
        
        
          and roadworks. The most important example is the Rio Hondo
        
        
          Dam, built in the 1960s, regardless dispersion problems (Grandi
        
        
          et al, 1961). The material used in this work is a silt with a clay
        
        
          content between 15 and 20% and plasticity index of 6%
        
        
          (Moretto et al, 1963). In structural revisions made several
        
        
          decades after its construction, it was concluded that the dam has
        
        
          adequate hydraulic behavior. Buraschi and Pujol (1999) have
        
        
          discussed the possibility of internal erosion in this dam.
        
        
          This paper discusses the hydraulic stability sandy silt soil
        
        
          type, in the compacted state. The material is subjected to
        
        
          erosion situations under the application of several hydraulic
        
        
          gradients. For the protection of silt, it has been used natural
        
        
          filters with different particle sizes. One of the most discussed
        
        
          issues at the international level is the testing methodology. The
        
        
          authors have optimized an analysis methodology based on the
        
        
          use of a filter cell. The results of the test campaign performed
        
        
          with the technique developed by the authors of this publication
        
        
          are presented.
        
        
          2 COMPOSITION OF THE STUDY


            2.1 Soil involved in testing


          The characteristics of the soil tested in these studies have
        
        
          been described by different authors, Reginatto (1970), Moll and
        
        
          Rocca (1991). Loessial soils of central Argentina are formed
        
        
          mainly by silt. The grain size composition comprising: sand
        
        
          (2% to 10%), silt (40% to 80%), and clay (20% to 35%). The
        
        
          composition is completed by calcium carbonate, variable
        
        
          between 2% and 10%, which exists in the form of nodules,
        
        
          called “toscas”, or precipitate in the contact between particles.
        
        
          These soils are alkaline, with pH> 8.
        
        
          The physical properties of the soil tested are shown in Table 1.
        
        
          Table 1.Properties of base material used
        
        
          Property
        
        
          Value
        
        
          Natural moisture (ω), (%)
        
        
          12.7 - 20.7
        
        
          Dry Unit Weight (


          d
        
        
          ), (kN/m
        
        
          3
        
        
          )
        
        
          12.3
        
        
          Specific Gravity (Gs)
        
        
          2.65
        
        
          Liquid Limit (ω
        
        
          l
        
        
          ), (%)
        
        
          24.4
        
        
          Plastic Limit (ω
        
        
          p
        
        
          ), (%)
        
        
          21.0
        
        
          Plastic Index (PI), (%)
        
        
          3.4
        
        
          Particles< 4.50 mm, (%)
        
        
          100.0
        
        
          Fines < 0.075 mm, (%)
        
        
          93.4
        
        
          Clay< 0.002 mm, (%)
        
        
          14.0
        
        
          USCS Classification
        
        
          ML
        
        
          Through compaction tests yielded a value of 15.5% optimum
        
        
          moisture and maximum dry unit weight of 17.6 kN/m
        
        
          3
        
        
          . To
        
        
          simulate conditions of poor compaction, tests were conducted
        
        
          with the application of 90% of the energy corresponding to
        
        
          Standard Proctor test.
        
        
          Fine grain sand was used as a base material for the
        
        
          construction of the filter. This type has been called SP, as the
        
        
          unified system. Zeballos et al (2010) have shown the unstable
        
        
          behavior of the system formed by compacted loess and filter,
        
        
          when it is formed only by sand. In the results presented in this
        
        
          paper, using filters formed by a combination of sand and silt
        
        
          loess, the filtration was measured. It has also been analyzing the
        
        
          operation of the set soil - filter, both under transient and steady
        
        
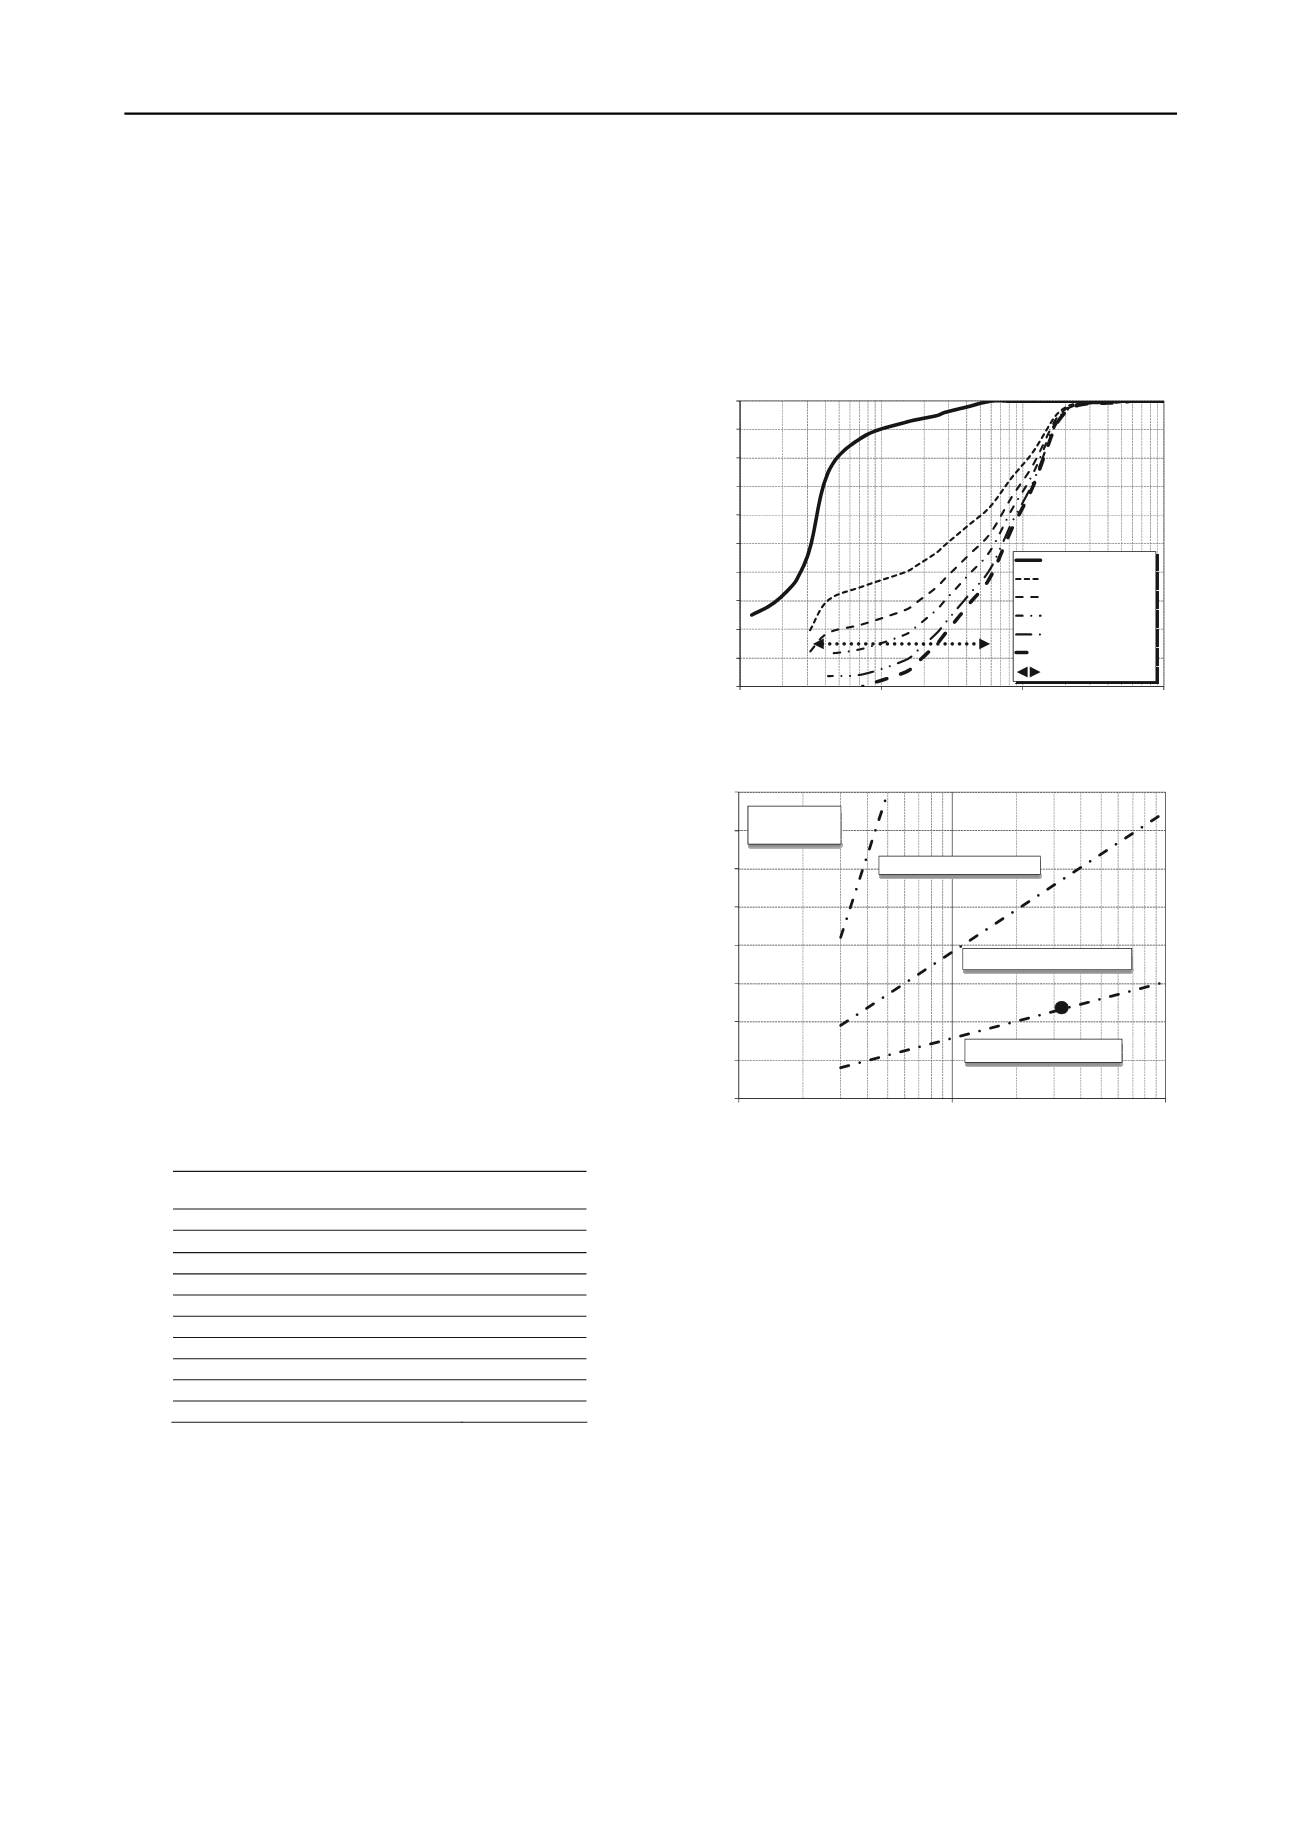
          flow. The mixtures tested as filters, have used combinations of
        
        
          sand and silt with a share of sand: 60%, 75%, 85% and 95%,
        
        
          relative to the total weight. The mixtures formed are presented
        
        
          in Figure 1. In the same Figure, the range corresponding to 15%
        
        
          pass filter (d
        
        
          15f
        
        
          %) frequently recommended, is presented. Each
        
        
          of these mixtures was tested with the application of hydraulic
        
        
          gradients in the order of 20, 40 and 80. Figure 2 shows the
        
        
          location of the soil analyzed according to the classification of
        
        
          Burenkova (1993).


            0


            10


            20


            30


            40


            50


            60


            70


            80


            90


            100


            0.01


            0.1


            1


            10


            Passing Porcentage [%]


            Grain Dimensions [mm]


          Silt
        
        
          60%sand - 40% silt
        
        
          75%sand - 25% silt
        
        
          85%sand - 15% silt
        
        
          95%sand - 5% silt
        
        
          Sand
        
        
          Recommended range
        
        
          Figure 1.Particle size of the soils used in the study.


            Base Soil


            SILT


            1.0


            1.5


            2.0


            2.5


            3.0


            3.5


            4.0


            4.5


            5.0


            1


            10


            100


            d90 / d60


            d90 / d15


            I - Suffusion Zone


            II - NO Suffusion Zone


            III - Suffusion Zone


            IV - Artificial


            Soils


          Figure 2.Burenkova chart for characterizing the potential of suffusion.
        
        
          Location of the studied silts
        
        
          .
        
        
          For the materials used in this study, it is possible to make the
        
        
          following comments:


          Burenkova graph, locates the soil base tested (loess silt), in
        
        
          the limit of the erosive behavior.


          Several filter mixtures tested has fines content greater than
        
        
          that normally recommended for the treatment of these
        
        
          problems, (not exceeding 5% of passing sieve 200).


            2.2 Tests Performed


          A filtration chamber of large dimensions has been designed.
        
        
          The cylindrical chamber has a height of 500 mm with a span of
        
        
          105 mm diameter. The chamber was constructed with
        
        
          transparent plastic, which allows visual monitoring of the
        
        
          filtration process. At its top, the chamber is connected with the
        
        
          water injection system pressure. In its lower part is connected to
        
        
          the flow registration system and containment system of solid
        
        
          particles. The chamber used, in schematic form, is presented in
        
        
          Figure 3.
        
        
          In the upper part of the chamber is placed a granular material
        
        
          (drain) to facilitate the distribution of incoming water to the
        
        
          beaker. This allows the water to reach the probe evenly. The
        
        
          soil tested is located below the drain. The height of the cylinder
        
        
          is regulated depending on the applied hydraulic gradient. The