 
          3327
        
        
          Technical Committee 210 + 201 /


            Comité technique 210 + 201


          monitored using an advanced technique known as persistent
        
        
          scatterer interferometry (PSI), based on satellite-borne remote
        
        
          sensors. As explained in Tosi


            et al.


          (2012), the method is based
        
        
          on the identification and exploitation of individual radar
        
        
          reflectors, or persistent scatterers (PS), that remain coherent
        
        
          over long time intervals so as to develop displacement-time
        
        
          series. A significant advantage of PSI is represented by the
        
        
          possibility of detecting displacements with very high spatial and
        
        
          temporal resolution. According to ENVISAT ASAR and
        
        
          TerraSAR-X satellite images acquired from April 2003 to
        
        
          December 2009 and from March 2008 to January 2009
        
        
          respectively, displacements of Venetian coastal structures
        
        
          turned out to range from a few mm/year for breakwaters and
        
        
          jetties older than 10 years to a maximum of 50-70 mm/year in
        
        
          the case of new or recently reshaped structures. Details on the
        
        
          whole PSI monitoring performed from Lido to Chioggia inlets
        
        
          are provided in Tosi


            et al.


          (2012).
        
        
          In this paper, we will focus our attention only on the long-
        
        
          term vertical displacements measured from March 2008 to
        
        
          January 2009 at the Malamocco inlet, with special reference to
        
        
          the 1280 m-long, curved breakwater built in recent years just
        
        
          outside the inlet. This structure has shown settlement rates that
        
        
          vary in the range 5÷25 mm/year, with the higher values
        
        
          observed close to the seaward edge of the breakwater.
        
        
          In order to apply the method described in section 3 and
        
        
          determine reliable values of


            C


          αε
        
        
          , profiles of four piezocone tests
        
        
          located along the breakwater (Figure 2) have been interpreted.
        
        
          As an example, Figure 3 shows the corrected cone resistance


            q


            t


          and pore pressure


            u


          measurements from CPTU M2, taken to 60
        
        
          m depth.
        
        
          All the soundings detail a complex soil profile of alternating
        
        
          silty sands, silts and silty clay, as recognized from prior studies
        
        
          performed at different sites of the Venetian lagoon. The pore
        
        
          pressure profiles rarely follow up the hydrostatic level, at times
        
        
          fall below it, but more often describe a slight contractive
        
        
          response, with generally moderate values of Δ


            u


          .
        
        
          Such stratigraphic complexity, typical of the whole Venetian
        
        
          lagoon subsoil, is confirmed by the well-known and newly
        
        
          revised piezocone-based classification framework proposed by
        
        
          Robertson (2009), aimed at identifying the


            in situ


          soil behavior
        
        
          0 5 10 15 20 25


              q


              t


            (MPa)


          60
        
        
          50
        
        
          40
        
        
          30
        
        
          20
        
        
          10
        
        
          0


            Depth (m)


          0.4
        
        
          1.2


              u


            (MPa)


              u


              0


              u


            W.T.


            W.T.


          Figure 3. CPTU M2 log profiles.
        
        
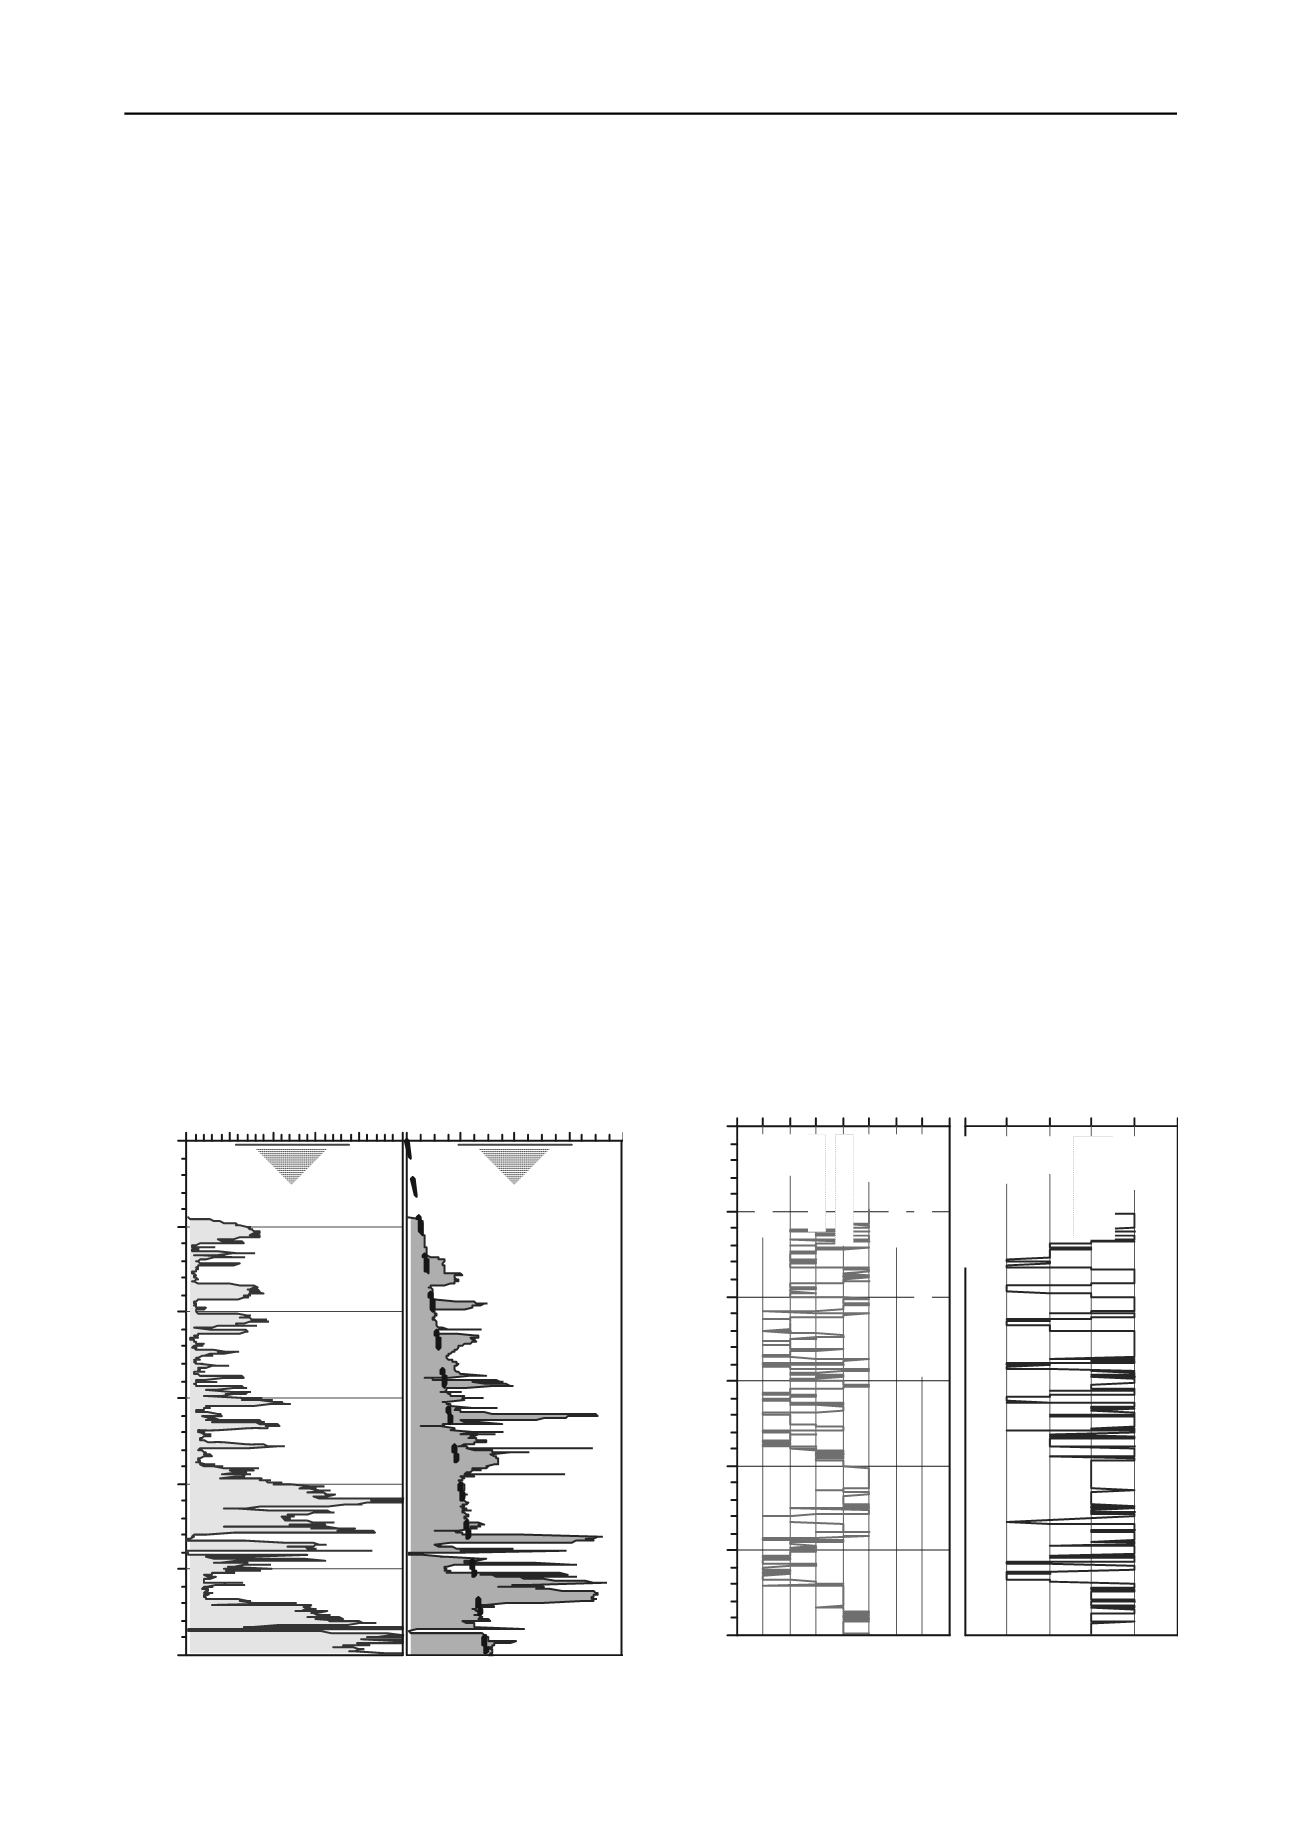
          type (SBT). Results from the application of the method to
        
        
          CPTU M2 data are shown in Figure 4. According to the SBT
        
        
          profile, the approach seems to predict a more pronounced clay-
        
        
          like behavior (zone 3) in comparison with the stratigraphic
        
        
          profiles obtained from nearby boreholes. Very thin layers of
        
        
          peat (zone 2) are at times detected, in particular from 22 to 48 m
        
        
          and from 51 to 53 m depth.
        
        
          Results from the rather sophisticated classification approach
        
        
          developed by Schneider


            et al.


          (2008) are also plotted in Figure
        
        
          4. This method, based on the normalized cone resistance (


            Q


          =
        
        
          (


            q


            t


          -


            v0


          )/


          '


            v0


          ) and the stress normalized excess pore pressure
        
        
          (


            u


          /


          '


            v0


          ), was primarily derived to aid in separating whether
        
        
          cone penetration is drained, undrained or partially drained,
        
        
          hence the approach is recognized as superior to other
        
        
          classification charts when evaluating piezocone measurements
        
        
          in clayey silts, silts, sandy silts and transitional soils.
        
        
          According to such classification framework, a large number
        
        
          of the CPTU M2 data fall in domains 1a and 3, this latter
        
        
          including a wide variety of mixed soil types.
        
        
          Finally, Figure 5 provides the profile of the computed


            C


          αε
        
        
          , as
        
        
          obtained from eqs. (2) and (3). Similar profiles have been
        
        
          obtained from the other available piezocone tests M1, M3 and
        
        
          M4. As evident from Figure 5, both formulations result in
        
        
          similar estimates of


            C


          αε
        
        
          , although eq. (3) seems to provide lower
        
        
          values in the upper sandy layers.
        
        
          In particular, the secondary compression coefficient in silts
        
        
          and silt mixtures (SBT zone 4) turns out to generally vary
        
        
          between 0.0015 ÷ 0.0035, rarely exceeding 0.004. Typical
        
        
          values of


            C


          αε
        
        
          in sand (SBT 6) fall in the interval 0.0005 ÷
        
        
          0.0008, whilst the range for sand mixtures (SBT 5) is somewhat
        
        
          higher (0.0007 ÷ 0.0018). Finally,


            C


          αε
        
        
          in clays-silty clays has
        
        
          been found to generally vary between 0.002 ÷ 0.006. It is worth
        
        
          observing that the computed values are in good agreement with
        
        
          the reference values of


            C


            αε


          derived from interpretation of long-
        
        
          term settlements observed at the Treporti Test Site.
        
        
          Secondary compression of thin layers of peat, occasionally
        
        
          present throughout the stratigraphic profile, is described by
        
        
          rather high values of


            C


          αε
        
        
          , such as 0.008 to 0.015. However, it is
        
        
          worth remarking that eqs. (2) and (3) have been not calibrated
        
        
          on such soil class, hence in this case the computed values of


            C


            αε


          cannot be applied without a great deal of uncertainty.
        
        
          1 2 3 4 5 6 7 8 9


            Soil Behaviour Type Zone


            (Robertson, 2009)


          60
        
        
          50
        
        
          40
        
        
          30
        
        
          20
        
        
          10
        
        
          0


            Depth (m)


            SoilType


            (Schneider et al., 2008)


          1c 1b 1a 3 2


            Sands


            Transitional


            soils


            Silts


            Clays


            Sensitive Clays


            Organic Soils


            Clays


            Silt mixtures


            Sand mixtures


            Sands


            Gravelly sands


            Very stiff sands to clayey sands


          Figure 4. CPTU-based classification methods applied to test M2.