3323
Technical Committee 210 + 201 /
Comité technique 210 + 201
filter is located below the probe, and then places another drain.
The test apparatus has a bottom plate with an outlet hole that
allows fluid control, and the collection of solid particles which
migrate from the soil or filter.
43,1mm
105 mm
500 mm
200 mm
50 mm 50 mm
200 mm
Orificio para Ingreso
Fluido y Control de Presión
O-Ring de goma - Sellador
175 mm
ESPACIO DE DISTRIBUCION
DE FLUIDO Y EQUILIBRIO DE
PRESIONES
(Material Dren)
SUELO BASE
FILTRO
ESPACIO DE DRENAJE INFERIOR
(Material Dren)
19 mm
O-Ring de goma - Sellador
30 mm
Orificio para Egreso de
Fluido y Recolección
30 mm
Orificio de vinculo entre cabezales
Orificio de vinculo entre cabezales
Hole for water ingress and
pressure control
Membranetype
O‐ring tire
Spindle‐hole adjustment
SAMPLE
Filter
Spindle‐hole adjustment
Membranetype
O‐ring tire
Exit hole wat r and solids
collection
SPACE BOTTOM
DRAIN
S ACE DISTRIBUTION F
FLUID
SPACE FOR APPLICATIONOF
PRESSURE
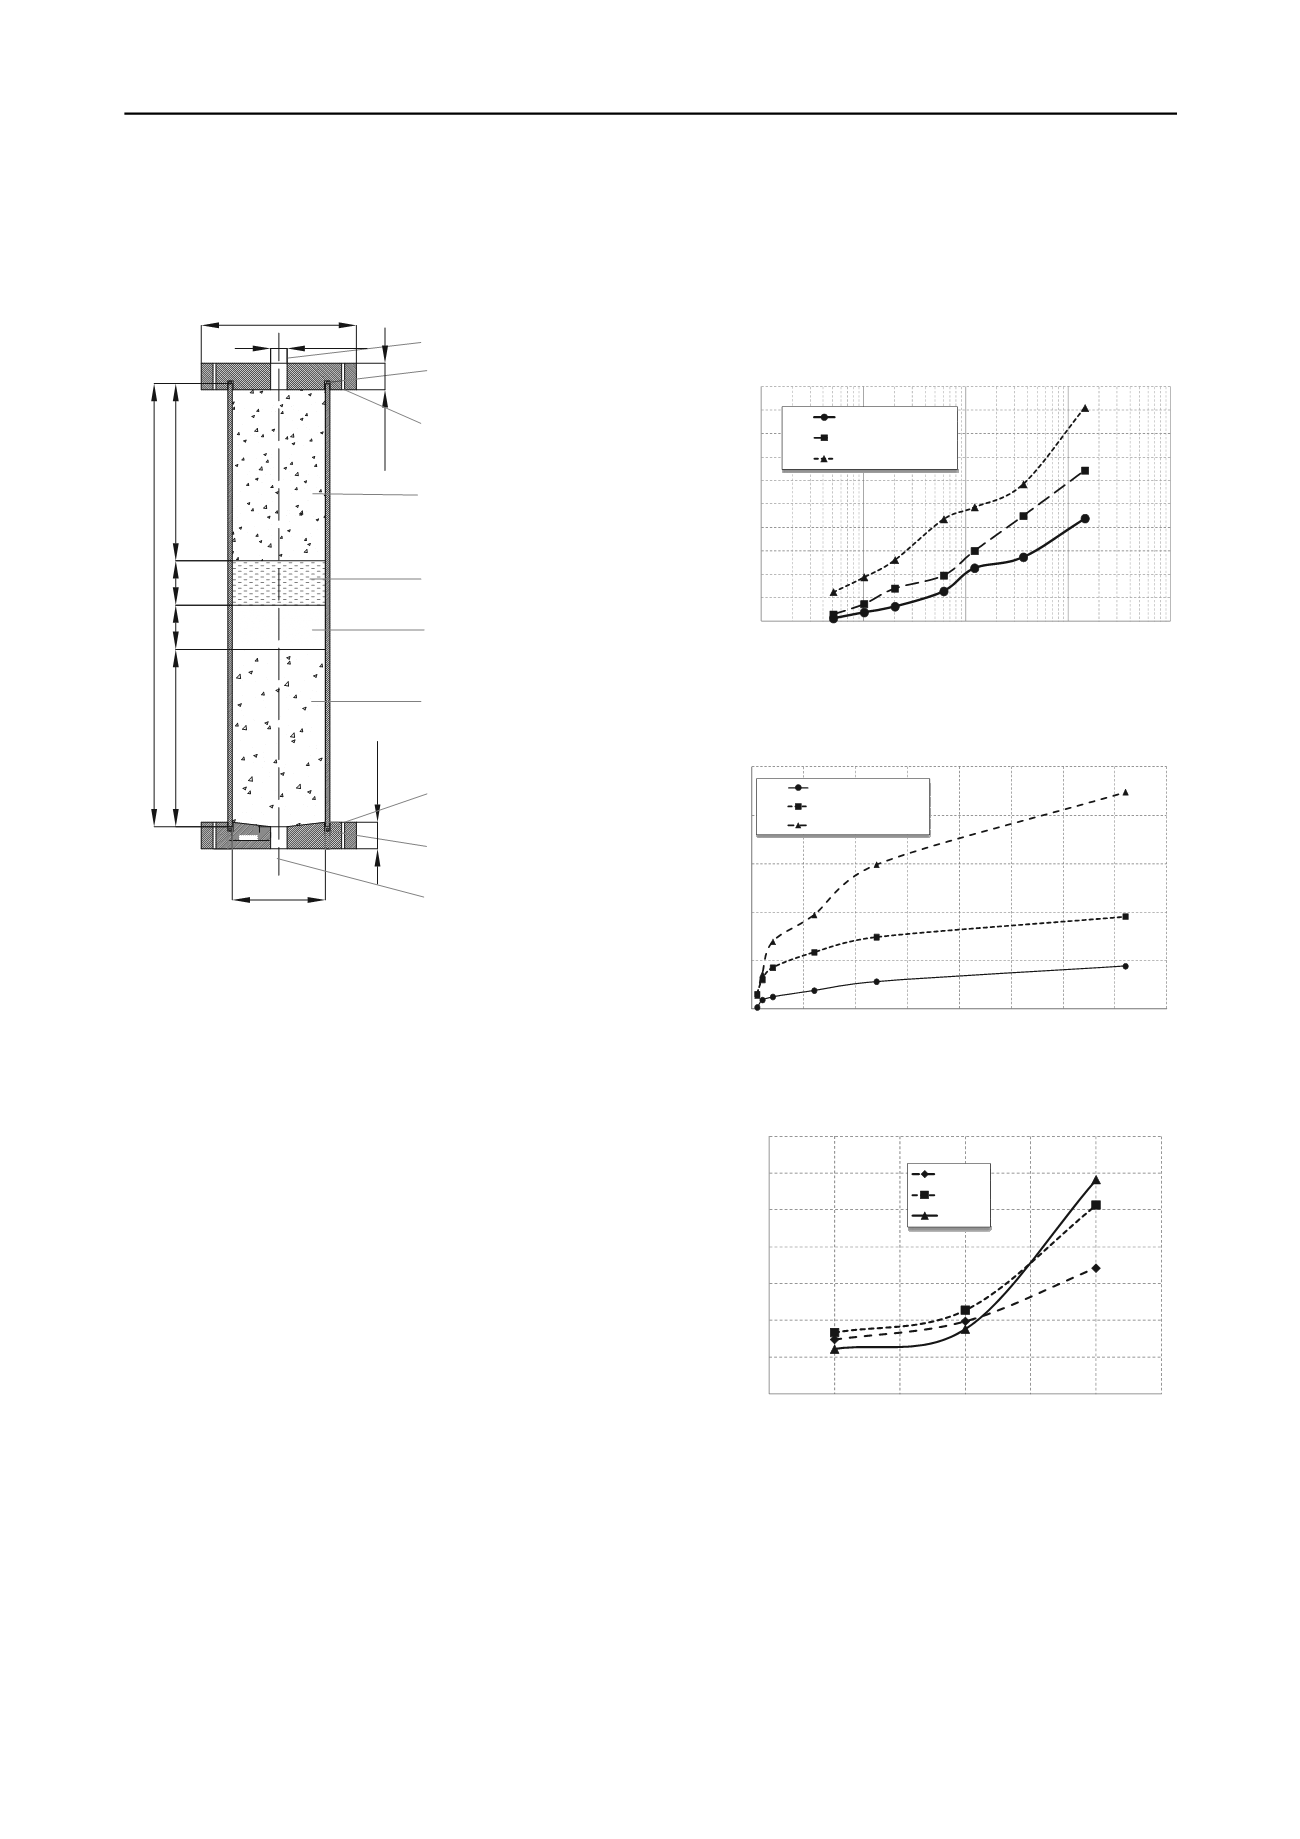
Figure 3. a) Schematic of the test system.
Prior to the execution of tests, a hole is drilled in the central
part of the specimen to simulate a crack from uncontrolled
erosion which could be initiated, or be achieved the overall
instability of the material.
In the preparation of the test system, some difficulties have
occurred in the installation of the filter and drain. An internal
protocol was developed to avoid the complications caused by
the lack of good contact between the various layers of the
filtration column.
Tests have been carried out, in all cases, starting the process
from the moisture condition of compaction. The filtered water
volume and the weight of the solids passing through the
filtration system were measured in all trials. In all cases,
measurements were performed at intervals of time. Tests have
lasted more than one day, until a leak was observed in steady
state condition.
3 RESULTS
The variables in the set of tests were as follows: a) volume of
water filtered vs. time, b) amount of filtered solids through the
system, c) filtration rate, when the process is in steady state, d)
steady state permeation.
Within the set of tests, the results for the filters with 60% of
sand are not included in this paper. These filters have shown a
highly unstable behavior, with great loss of material during
filtration.
Figures 4a and 4b, for example, show the variation in the
volume of filtered water to the various mixtures made and
applied gradients. There is a growing trend for leaks with the
gradient applied. The same trend was observed with the sand
content in the filter.
In relation to the migration of particles, Figure 5 shows the
percentage of solids that migrate with respect to the initial dry
weight of the sample. The solids lost during the test tend to
increase proportionally to the content of sand in the mixture.
The losses are moderate for the filters having no more than 85%
sand. For filters with 95% sand, the loss rate increases to more
than double, compared to the previous cases. Much of the
migration of solids occurs in the first minutes of the test. After
the initial stage there is clear water seepage through the system.
Figure 4.a. Changes in the volume of filtered water, as represented in
logarithmic scale.
0
500
1000
1500
2000
2500
3000
3500
4000
4500
5000
1
10
100
1000
10000
Volume of water passing through the
specimen (cm
3
)
Time (min)
Grad80 ‐ 75%Sand
Grad80 ‐ 85%Sand
Grad80 ‐ 95%Sand
0
500
1000
1500
2000
2500
0
50
100
150
200
250
300
350
400
Volume of water passing through the
specimen (cm
3
)
Time (min)
Grad20 ‐ 85%Sand
Grad40 ‐ 85%Sand
Grad80 ‐ 85%Sand
Figure 4.b. Representation of the evolution of the volume filtered,
represented in full scale
0.00
0.05
0.10
0.15
0.20
0.25
0.30
0.35
70% 75% 80% 85% 90% 95% 100%
% Solids with respect to the dry weight
of soil sample
% of sand in filter
Grad 20
Grad40
Grad80
Figure 5.Solids losses during the test.
The filtration system tested shows a leak with the
characteristics of a regular stationary regime after an initial
transient stage.
The stability of the system can be seen through the
identification of the mean values of permeability. These values
are constant, even for different values of gradients.
The results, measured as rate of leak flux in the stationary
phase and the permeability at this stage are shown in Table 2.
filter is located below the probe, and then places another drain.
The test apparatus has a bottom plate with an outlet hole that
allows fluid control, and the collection of solid particles which
migrate from the soil or filter.
43,1mm
105 mm
500 mm
200 mm
50 mm 50 mm
200 mm
Orificio para Ingreso
Fluido y Control de Presión
O-Ring de goma - Sellador
175 mm
ESPACIO DE DISTRIBUCION
DE FLUIDO Y EQUILIBRIO DE
PRE IONES
(Material Dren)
SUELO BASE
FILTRO
ESPACIO DE DRENAJE INFERIOR
(Material Dren)
19 mm
O-Ring de goma - Sellador
30 mm
Orifi io para Egreso de
Fluido y Recolección
30 mm
Orificio de vinculo entre cabezales
Orificio de vinculo entre cabezales
Hole for water ingress and
pressure control
Membranetype
O‐ring tire
Spindle‐hole adjustment
SAMPLE
Filter
Spindle‐hole adjustment
Membranetype
O‐ring tire
Exit hole water a d solids
collectio
SPACE BOTTOM
DRAIN
PACE DISTRIBUTION F
FLUID
SPACE FOR APPLICATIONOF
PRESSURE
Figur 3. a) Schematic of the test system.
Prior to the execution of tests, a hole is drilled in the central
part of the specimen to simulate a crack from uncontrolled
erosion which could be initiated, or be achieved the overall
instability of the material.
In the preparation of the test system, some difficulties have
occurred in the installation of the filter and drain. An internal
protocol w s developed to avoid the complications caused by
the lack of good contact between the various layers of t
filtration column.
Tests h ve been carried out, in all cases, starting the process
from the moisture c ndition of compaction. The filtered water
volume and the weight of the solids passing t rough the
filtration system were measured in all trials. In all cases,
measurements were performed at intervals of time. Tests have
lasted more than one day, until a leak was observed in steady
state condition.
3 RESULTS
The variables in the set of tests were as follows: a) volume of
water filtered vs. time, b) amount of filtered solids through the
system, c) filtration rate, when the process is in steady state, d)
steady state permeation.
Within the set of tests, the results for the filters with 60% of
weight of the sample. The solids lost during the test tend to
increase proportionally to the content of sand in the mixture.
The losses are moderate for the filters having no more than 85%
sand. For filters with 95% sand, the loss rate increases to more
than double, compared to the previous cases. Much of the
migration of solids occurs in the first minutes of the test. After
the initial stage there is clear water seepage through the system.
Figure 4.a. Changes in the volume of filtered water, as represented in
logarithmic scale.
0
500
1000
1500
2000
2500
3000
3500
4000
4500
5000
1
10
100
1000
10000
Volume of water passing through the
specimen (cm
3
)
Time (min)
Grad80 ‐ 75%Sand
Grad80 ‐ 85%Sand
Grad80 ‐ 95%Sand
0
500
1000
1500
2000
2500
0
50
100
150
200
250
300
350
400
Volume of water passing through the
specimen (cm
3
)
Time (min)
Grad20 ‐ 85%Sand
Grad40 ‐ 85%Sand
Grad80 ‐ 85%Sand
Figure 4.b. Representation of the evolution of the volume filtered,
represented in full scale
0.00
0.05
0.10
0.15
0.20
0.25
0.30
0.35
70% 75% 80% 85% 90% 95% 100%
% Solids with respect to the dry weight
of soil sample
% of sand in filter
Grad 20
Grad40
Grad80
Figure 5.Solids losses during the test.
The filtration system tested shows a leak with the
filter is located below the probe, and then places another drain.
The test apparatus has a bottom plate with an outlet hole that
allows fluid control, and the collection of solid particles which
migrate from the soil or filter.
43,1mm
105 mm
500 mm
200 mm
50 mm 50 mm
200 mm
Orificio para Ingreso
Fluido y Control de Presión
O-Ring de goma - Sellador
175 mm
ESPACIO DE DISTRIBUCION
DE FLUIDO Y EQUILIBRIO DE
PRESIONES
(Material Dren)
SUELO BASE
FILTRO
ESPACIO DE DRENAJE INFERIOR
(Material Dren)
19 mm
O-Ring de goma - Sellador
30 mm
Orificio para Egreso de
Fluido y Recolección
30 mm
Orificio de vinculo entre cabezales
Orificio de vinculo entre cabezales
Hole for water ingress and
pressure control
Membranetype
O‐ring tire
Spindle‐hol adjustment
SAMPLE
Filter
Spindle‐hole adjustment
Membranetyp
O‐ring tire
Exit hole wat r and solids
collection
SPACE BOTTOM
DRAIN
S A E DISTRIBUTION F
FLUID
SPACE FOR APPLICATIONOF
PRESSURE
Figure 3. a) Schematic of the test system.
Prior to the execution of tests, a hole is drilled in the central
part of the specimen to simulate a crack from uncontrolled
erosion whic could be initiated, or be achieved the overall
instability of th material.
In the preparation of the test system, some difficulties have
occurred in the installation of the filter and drain. An internal
protocol was devel ped to avoid the complications caused by
the lack of good contact betwe n the various lay rs of the
filtrati n column.
Tests have been carried out, in all cases, starting the process
from the moisture condition of compaction. The filtered water
volume and th weight of the solids pa sing through the
iltration system were measured in all trials. In all cases,
measurements were perfor ed at intervals of time. Tests hav
lasted more than on day, until a leak was ob erved in steady
state condition.
3 RESULTS
The variables in the set of tests were as follows: a) volume of
water filtered vs. time, b) amount of filtered solids through the
system, c) filtration rate, when th process is in steady state, d)
steady state permeation.
Within the set of tests, the results for the filters with 60% of
sand are not included in this paper. These filters have shown a
highly u stable behavior, with great loss of material during
filtration.
Figures 4a and 4b, for example, show the variation in the
volume of filtered water to the various mixtures made and
applied gradients. There is a growing trend for leaks with th
gradient applied. The same trend was observed with the s
content in the filter.
In relation to the migration of particles, Figure 5 shows the
perc tage of solids that migrate with respect to the initial dry
weight of the sample. The solids lost during the test tend to
increase proportionally to the content of sand in the mixture.
The losses ar moderate for the filters having no mor than 85%
sand. For filters with 95% sand, the loss rate increas s to more
than double, compared to the previous cases. Muc of the
migrati n of solids occurs in the first minut s of the test. After
t e initial stage there is clear water seepage through the system.
Figure 4.a. Changes in the volume of filt red wate , as repr sented in
logarithmic scale.
0
1
1
2
2
3 0
3
4000
4500
5000
1
10
100
1000
10000
Volume of water passing through the
specimen (cm
3
)
Time (min)
Grad80 ‐ 75%Sand
Grad80 ‐ 85%Sand
Grad80 ‐ 95%Sand
5
0
15
0
2500
0
50
100
150
200
250
300
350
400
Volume of water passing through the
specimen (cm
3
)
Time (min)
Grad20 ‐ 85%Sand
Grad40 ‐ 85%Sand
Grad80 ‐ 85%Sand
Figure 4.b. Representation of the evolution of the volume filtered,
represented in full scale
0.00
0.05
0.10
0.15
0.20
0.25
0.30
0.35
70% 75% 80% 85% 90% 95% 100%
% Solids with respect to the dry weight
of soil sample
% of sand in filter
Grad 20
Grad40
Grad80
Figure 5.Solids losses during the test.
The filtration system tested shows a leak with the
characteristics of a regular stationary regime after an initial
transient stage.
The stability of the sy tem can be s en through the
ide tification of the mean values of permeability. These values
are constant, even f r different values of gradients.
The results, m asured as rate of leak flux in the tationary
phase and the p rmeability at this stage are shown in Table 2.


