3331
Technical Committee 210 + 201 /
Comité technique 210 + 201
absolute values and not expressed as a percentage. The average
water content in the peat increases with depth from 6.45 (645%)
to 12.4 (1240%). The organic clay layer shows lower values,
with a large scatter. In the non-organic clay layer the water
content reduces to 0.74 (74%).
A series of CPTs, including measurements with different
cone types and ball penetrometer tests, finalises the subsoil
characterisation. Figure 1 shows a typical CPT for the test field.
In this CPT, the succession of subsoil layers can be recognized.
According to Eurocode ISO/DIS 22476-1:2005,IDT the
measurements represent a class 2 type CPT. For a class 2 CPT
, q
c
, equals 100 kPa. Figure 1
resistance in peat and are therefore used for
co
Simple Shear (DSS)
tes
stress conditions. Since
aches the
su
low, in the order
ents for each
, a ball
ately 0.5
point in the
-
sample
or each
sam
istance
is led
to th
va
cavation, the ditch bottom rose
due to
ining depth during the test
were stepwise filled with
water.
0.25 m increase in water
level.
t step if no failure had
rmation rates slowed
l in the ditch was stepwise
decre
of a 0.25 m lowering of the water
lowering the water table in
instrumentation placed in the second measurement row is
shown. At three depths in the peat layer and at one depth in the
clay layer, the pore pressure development was measured with
Vibrated Wire Probes, VWPs and horizontal displacements
were with a SAA unit, see Abdoun (2007), placed at the front of
the container row. For measurement rows 1 and 2 the pore
pressure development was measured at only two locations in the
peat layer. Besides the instrumentation in the measurement rows
the settlement under the middle two containers was measured
with automated settlement plates, the water level in the
container was measured for each container and the heave of the
ditch after excavation was measurement with settlement plates.
the accuracy of the tip resistance
indicates for the peat a tip resistance of the same order of
magnitude as the accuracy for which the CPT is conducted. This
is typical for peat areas and also reported for other locations
Den Haan & Kruse (2007) and Boylan et al. (2011). The low
accuracy for these measurements makes the conventional class
2 CPT inadequate for accurate correlations with strength
parameters. Ball penetrometer tests give a more accurate
reading of the
rrelation purposes.
occurred in the previous step and defo
3 LABORATORY TESTING
A large series of triaxial tests and Direct
ts were conducted. Discussion of all the test results is beyond
the scope of this paper. This paper focusses on the DSS tests for
which the sample was consolidated at approximately field
stresses. The results of these tests were used to correlate the
undrained shear strength,
s
u,
to ball penetrometer tests according
to equation (2).
(2)
in which
q
ball
represents the penetration resistance of the ball
and
N
ball
represents the resistance factor.
In total 5 samples were tests at field
the density of the peat is low and the water table re
rface the vertical effective stresses are also
of 2 – 7 kN/m
2
. In the set-up of the field measurem
boring, used to retrieve samples for DSS testing
penetrometer test is executed at a distance of approxim
m. The DSS-strength is defined as the deflection
’ diagram, representing the shear stress where the
behaviour changes from compression to dilation. F
ple the DSS-strength is compared to the measured res
in the nearby ball penetrometer test at the same depth. Th
e correlation of
N
ball
= 17.9
1.2.
Figure 6. Su from ball penetrometer test S15e and DSS test results.
Red square indicates DSS test at nearby location, red triangles other test
results.
The undrained shear strength from the DSS tests ranges from
6.7 tot 7.7 kN/m
2
with an average value of 7.1 kN/m
2
. The
riation in the test results is small and the average value for
N
ball
found for the individual DSS test results fits well to the
overall strength profile.
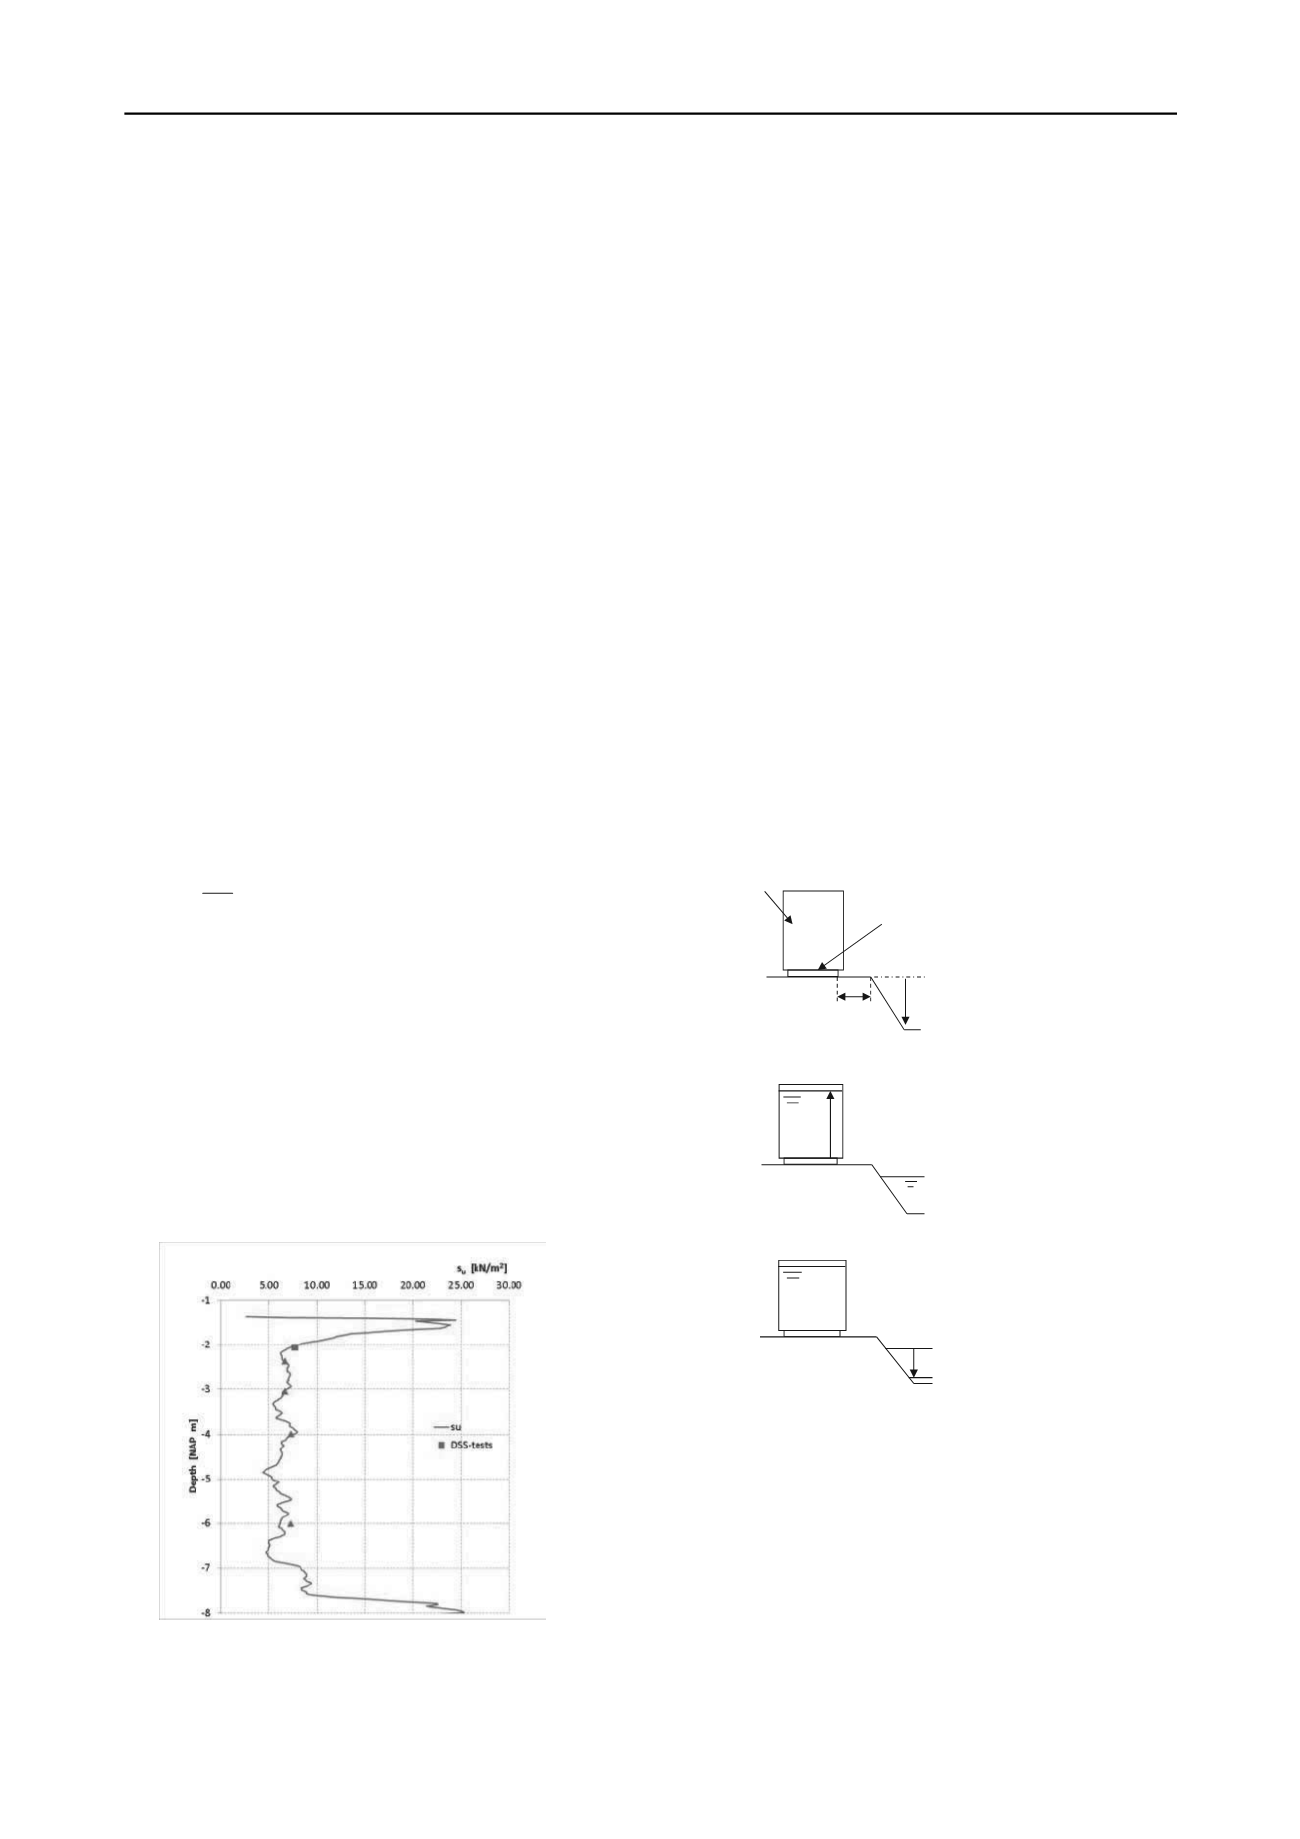
4 TEST SET-UP
In total 5 field tests are conducted. In the first two tests the peat
is loaded in a few days to failure. The other 3 field tests include
a two-periods loading procedure with several weeks of
preloading before failure. This paper focusses only on the first
two tests. For testing reproducibility the test loading is identical.
Figure 7 shows the 3 loading phases of these tests.
In loading phase 1, a row of containers is placed and a ditch
is excavated. The containers have the dimensions of 7.25 m
(length) × 2.5 m (width) × 2.2 m (height). The ditch has a depth
of 2.5 m and slope 1:1. After ex
swelling of the peat. The rema
was approximately 2 m.
In loading phase 2, the containers
Each load step consisted of a
It was decided to start the nex
down significantly.
In loading phase 3, the water leve
ased. Each step consists
table. Failure was found after
loading phase 3.
a) loading phase 1
container
Concrete slab
Figure 7. Planned test set-up
The instrumentation was concentrated in three measurement
rows, see Figure 8. In figure 9 the location of the
ball
u
ball
q s
N
excavation
2.5 m
1 m
b) loading phase 2
c) loading phase 3
were wi
the con
pressur
peat lay
the sett
with a
contain
ditch af
Figure 6. Su from ball penetrometer test S15e and DSS test results.
Red square indicates DSS test at nearby location, red triangles other test
results.
The undrained shear strength from the DSS tests ranges from
6.7 tot 7.7 kN/m
2
with an average value of 7.1 kN/m
2
. The
absolute values and not expressed as a percentage. The average
water content in the peat increases with depth from 6.45 (645%)
to 12.4 (1240%). The organic clay layer shows lower values,
with a large scatter. In the non-organic clay layer the water
content reduces to 0.74 (74%).
A series of CPTs, including measurements with different
cone types and ball penetrometer tests, finalises the subsoil
characterisation. Figure 1 shows a typical CPT for the test field.
In this CPT, the succession of subsoil layers can be recognized.
According to Eurocode ISO/DIS 22476-1:2005,IDT the
measurements represent a class 2 type CPT. For a class 2 CPT
, q
c
, equals 100 kPa. Figure 1
resistance in peat and are therefore used for
co
Simple Shear (DSS)
tes
stress conditions. Since
aches the
su
low, in the order
ents for each
, a ball
ately 0.5
point in the
-
sample
or each
sam
istance
is led
to th
va
cavation, the ditch bottom rose
due to
ining depth during the test
were stepwise filled with
water.
0.25 m increase in water
level.
t step if no failure had
rmation rates slowed
l in the ditch was stepwise
decre
of a 0.25 m lowering of the water
lowering the water table in
instrumentation placed in the second measurement ro is
shown. At three depths in the peat layer and at one depth in the
clay layer, the pore pressure development was measured with
Vibrated Wire Probes, VWPs and horizontal displacements
were with a SAA unit, see Abdoun (2007), placed at the front of
the container row. For measurement rows 1 and 2 the pore
pressure development was measured at only two locations in the
peat layer. Besides the instrumentation in the measurement rows
the settlement under the middle two containers was measured
with automated settlement plates, the water level in the
container was measured for each container and the heave of the
ditch after excavation was measurement with settlement plates.
the accuracy of the tip resistance
indicates for the peat a tip resistance of the same order of
magnitude as the accuracy for which the CPT is conducted. This
is typical for peat areas and also reported for other locations
Den Haan & Kruse (2007) and Boylan et al. (2011). The low
accuracy for these measurements makes the conventional class
2 CPT inadequate for accurate correlations with strength
parameters. Ball penetrometer tests give a more accurate
reading of the
rrelation purposes.
occurred in the previous step and defo
3 LABORATORY TESTING
A large series of triaxial tests and Direct
ts were conducted. Discussion of all the test results is beyond
the scope of this paper. This paper focusses on the DSS tests for
which the sample was consolidated at approximately field
stresses. The results of these tests were used to correlate the
undrained shear strength,
s
u,
to ball penetrometer tests according
to equation (2).
(2)
in which
q
ball
represents the penetration resistance of the ball
and
N
ball
represents the resistance factor.
In total 5 samples were tests at field
the density of the peat is low and the water table re
rface the vertical effective stresses are also
of 2 – 7 kN/m
2
. In the set-up of the field measurem
boring, used to retrieve samples for DSS testing
penetrometer test is executed at a distance of approxim
m. The DSS-strength is defined as the deflection
’ diagram, representing the shear stress where the
behaviour changes from compression to dilation. F
ple the DSS-strength is compared to the measured res
in the nearby ball penetrometer test at the same depth. Th
e correlation of
N
ball
= 17.9
1.2.
Figure 6. Su from ball penetrometer test S15e and DSS test results.
Red square indicates DSS test at nearby location, red triangles other test
results.
The undrained shear strength from the DSS tests ranges from
6.7 tot 7.7 kN/m
2
with an average value of 7.1 kN/m
2
. The
riation in the test results is small and the average value for
N
ball
found for the individual DSS test results fits well to the
overall strength profile.
4 TEST SET-UP
In total 5 field tests are conducted. In the first two tests the peat
is loaded in a few days to failure. The other 3 field tests include
a two-periods loading procedure with several weeks of
preloading before failure. This paper focusses only on the first
two tests. For testing reproducibility the test loading is identical.
Figure 7 shows the 3 loading phases of these tests.
In loading phase 1, a row of containers is placed and a ditch
is excavated. The containers have the dimensions of 7.25 m
(length) × 2.5 m (width) × 2.2 m (height). The ditch has a depth
of 2.5 m and slope 1:1. After ex
swelling of the peat. The rema
was approximately 2 m.
In loading phase 2, the containers
Each load step consisted of a
It was decided to start the nex
down significantly.
In loading phase 3, the water leve
ased. Each step consists
table. Failure was found after
loading phase 3.
a) loading phase 1
container
Concrete slab
Figure 7. Planned test set-up
The instrumentation was concentrated in three measurement
rows, see Figure 8. In figure 9 the location of the
ball
u
ball
q s
N
excavation
2.5 m
1 m
b) loading phase 2
c) loading phase 3


