3332
Proceedings of the 18
th
International Conference on Soil Mechanics and Geotechnical Engineering, Paris 2013
Figure 8. Top view
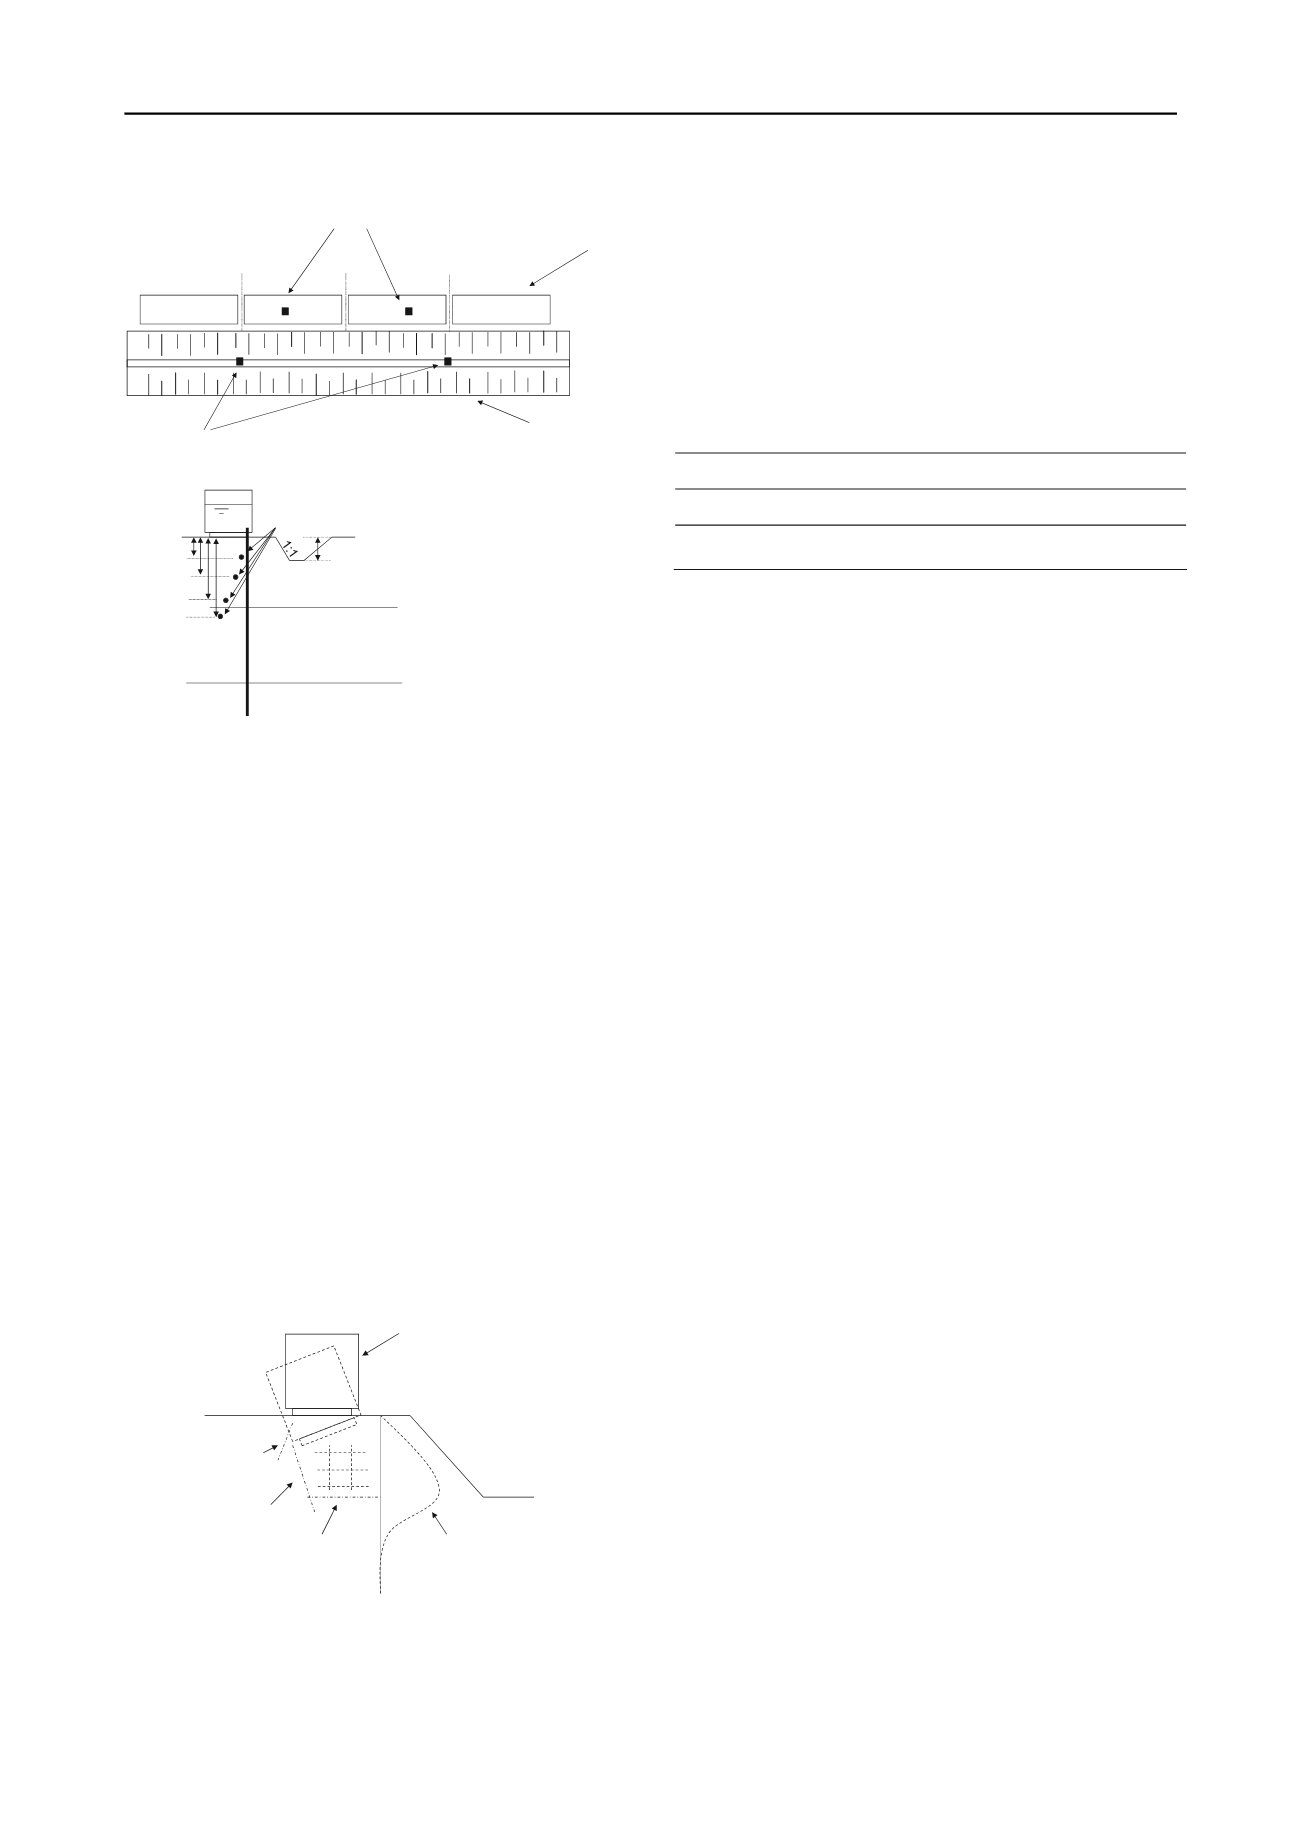
Figure 9. Instrumented cross section, VWP = vibrated wire probe.
5 RESULTS
The tests were run in approximately three days and this loading
scheme resembles the loading velocity for river dikes, where
high water levels rise and decline in a matter of days.
After the test was finished an excavation pit was made to
study subsoil cracks and failure planes. These observations
resulted in a reconstruction of the failure mechanism as shown
in Figure 10 At the active side a clear and nearly vertical rupture
plane was found accompanied with a secondary, backward
running crack. This rupture plane intersected a nearly horizontal
rupture plane. The horizontal rupture plane is only found at the
at
er row, is
e was found at the
act
the ditch was
at the horizontal
dis
ers were
e
ne a series
ound. It is not
the test, when
to the
dimensions of the field tests are limited, 3D effects play
Bas
imensions of the failure plan s estimated
the friction along the sides of the failure mechanism adds
app
y 10% extra friction to a plane strain assu
failure plane. So, failure is to be found for a calculated Safety
r the analysis the Spencer and LiftVan
he LiftVan method, Van et al (2005), is
a B
active side of the failure. The maximum displacement found
the end of the test, measured at the front of the contain
found at the same depth as the rupture plan
ive side. At the end of the test the slope of
nearly unaffected. This led to the conclusion th
placements, measured at the front of the contain
followed by horizontal compaction of the peat between th
containers and ditch.
Between the containers and horizontal rupture pla
of minor horizontal and vertical cracks were f
known whether these cracks were formed during
the peat layer was loaded or after during swelling due
removal of the load.
Figure 10. Sketch of failure mechanism.
6 ANALYSIS
After finalizing the field tests, an extended analysis was
conducted including limit equilibrium analysis. Since the
a role.
ed on the d
es it i
that
roximatel
med
automated settlement plates
Factor, SF = 0.9. Fo
method were applied. T
ishop based method and includes a horizontal sliding plane
between the active and passive parts of the slip circle with
different radii. Back analysis with the conditions at which
failure was found led to the average undrained shear strength,
s
u,
available at failure. Table 1 shows the results.
Table 1. Back analysis of test results,
s
u
in [kN/m
2
] for which SF = 0.9.
Model
Test 1
Test 2
LiftVan
7.0
7.8
Spencer
7.3
8.0
7 CONCLUSIONS
The large scale field tests on the peat subsoil were conducted
successfully. Measurements show an equivalent development of
deformations and pore pressure in both tests. Together with the
small differences found in the back analysis this indicates a
go reproducibility of these tests.
The strength found in the D
od
SS lab tests, in which the
hows that the
istance during the test is in the range
esponds well to the strength found
for
The
9
Abd
007 Field
Boylan N., Long M., Mathijssen F.A.J.M. 2011 In situ strength
characterisation of peat and organic soil using full flow
penetrometers
Can Geotech J.
48
:1085-1099
Den Haan E.J. (2007) De intrinsieke tijd in het isotachenmodel
Geotechniek
12
(1), 34-38 (in Dutch)
Den Haan, E.J. & Kruse, G.A.M. (2007) Characterisation and
engineering properties of Dutch peats In:
Second international
workshop on characterisation and engineering of natural soils
Singapore
vol. 3 London Taylor & Francis p 2101 -2133
Skempton A.W., Petley D.J. 1970. Ignition loss and other properties of
peats and clays from Avonmouth, Kings Lynn and Cranberry Moss,
Géotechnique
20
(4), 343-356.
Van M.A., Koelewijn A.R., Barends F.B.J. 2005 Uplift phenomenon :
Model, Validation and Design
international Journal of
Geomechanics
5:2, 98-106.
samples are consolidated at field stress level, correlate well to
ball penetrometer tests. This resulted in a correlation between
the ball cone field test and the DSS lab test.
he back analysis of the container tests s
T
average available shear res
of 7 to 8 kN/m
2
. This corr
from the DSS tests.
The combination of ball penetrometer tests and DSS tests,
which the sample is consolidated at field stress level,
vide a valuab
pro
le tool in obtaining peat strength parameters for
safety assessments of dikes on peaty subsoil.
8 ACKNOWLEDGEMENTS
research project, including the field tests, is initiated and
funded by Hoogheemraadschap Hollands Noorderkwartier in
cooperation with Rijkswaterstaat – Waterdienst.
REFERENCES
oun T., Bennet V., DanischL., Shantz T. & Jang D. 2
Installation details of a wire-less shape-acceleretion array system
for geotechnical applications
Proceedings of SPIE, San Diego
volume 6529
Becker D.E., Crooks J.H.A., Been K., Jefferies M.G. 1987 Work as a
criterion for determining in situ and yield stresse in clays
Can.
Geot. J
24
:549-564
1
row 1
container row
row 2
row 3
2
3
4
excavation
settlement plate
clay
peat
2.5 m
VWP
4,6 m
SAA
1,6 m
3,1 m
sand
5,6 m
measured horizontal
displacements
horizontal fracture and
several minor vertical cracks
main vertical fracture
secondary vertical
fracture
tilted container


