2709
Technical Committee 212 /
Comité technique 212
240
210
167
103
25
280
253
196
115
27
320
280
222
126
23
360
315
253
154
23
387
-
272
161
23
Table 3. Load at depth for the 0.4m pile.
Load at respective levels (kN)
Load at top
(kN)
3.1m
5.3m
7.5m
9.7m
40
37
35
32
1
80
64
56
46
3
120
118
104
75
11
160
150
126
83
11
200
187
158
110
11
240
217
185
123
11
280
249
211
136
11
320
284
233
144
11
360
318
265
163
11
400
340
278
166
8
440
-
302
190
8
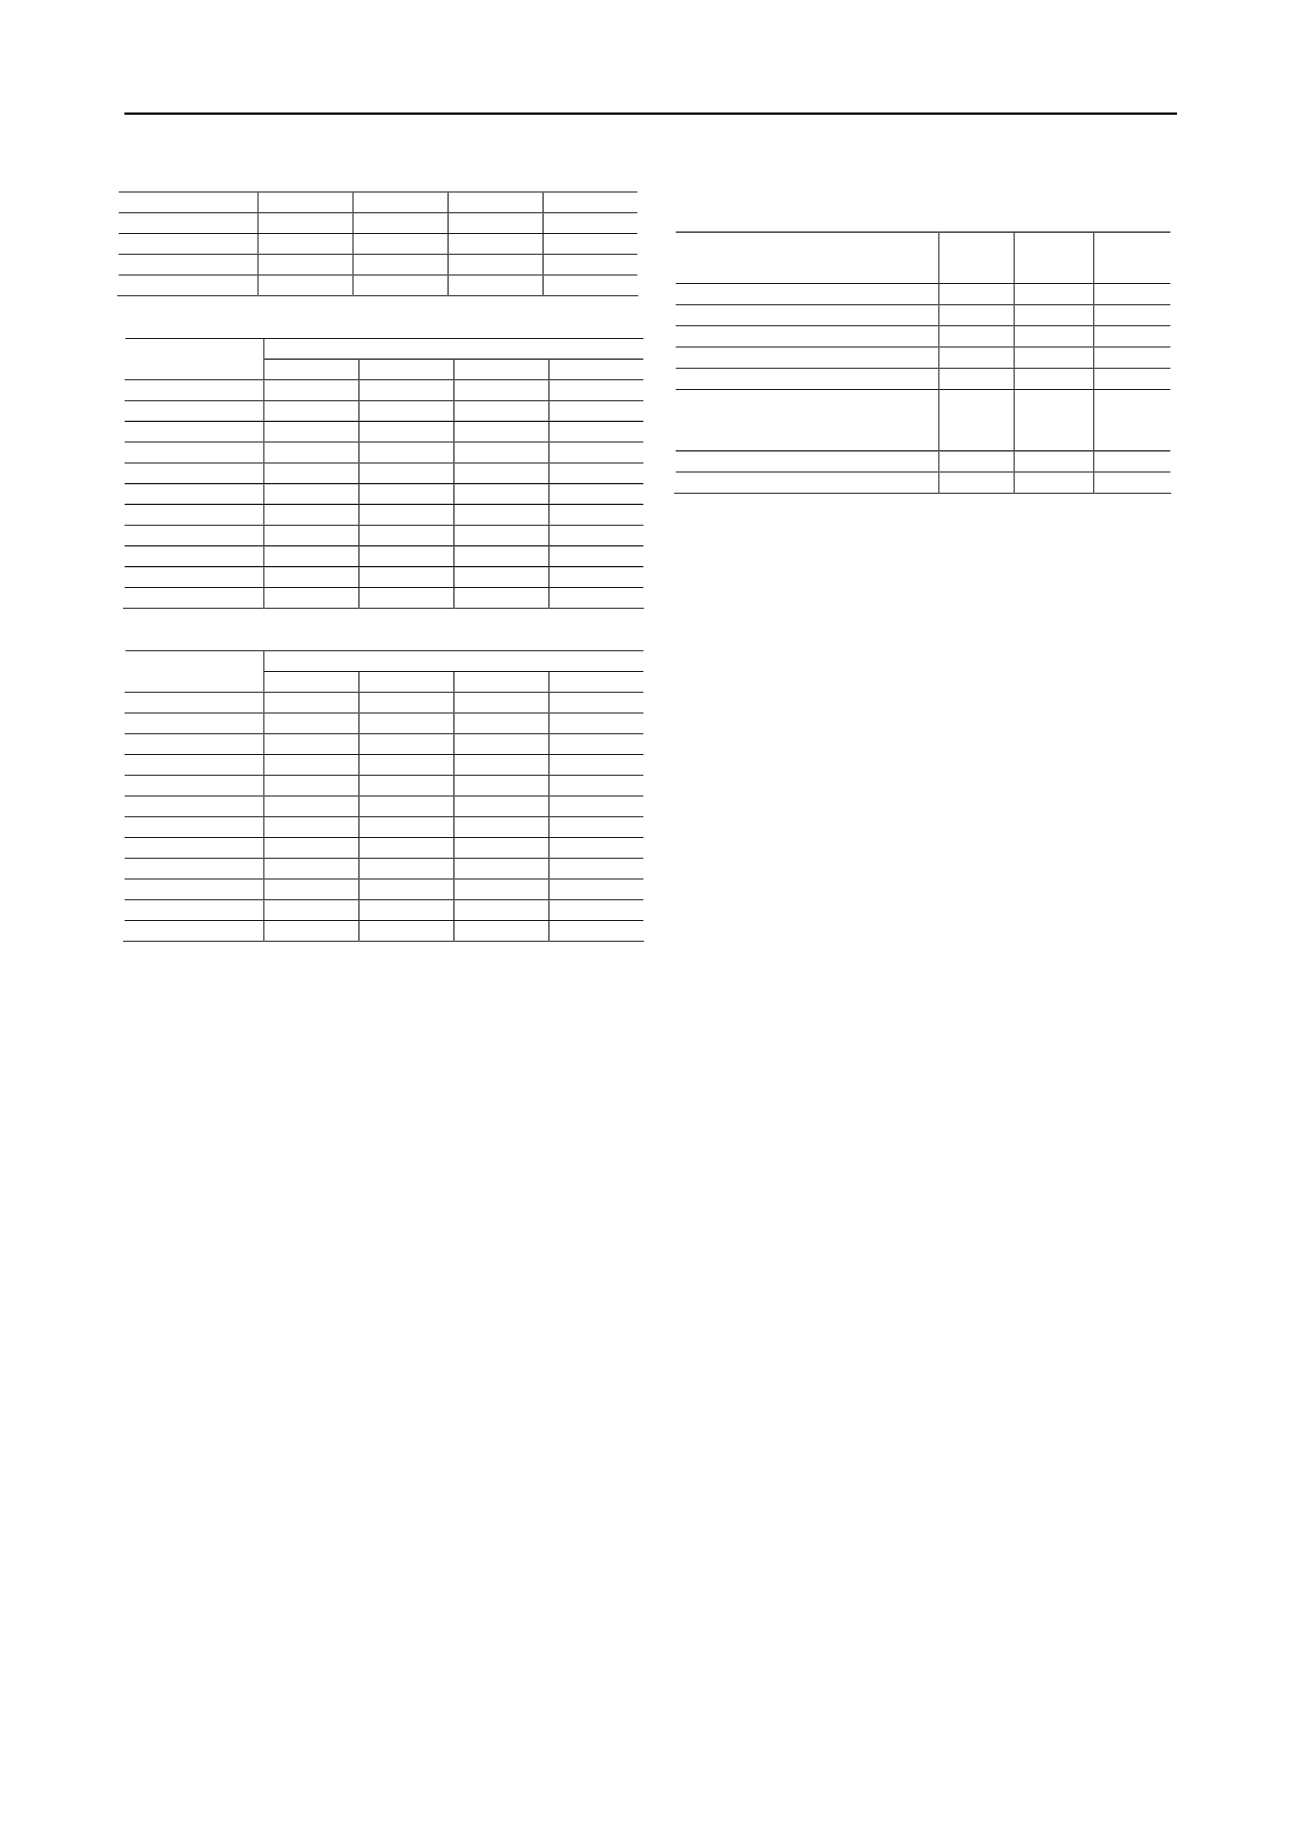
Table 4. Load at depth for the 0.5m pile
Load at respective levels (kN)
Load at top
(kN)
3.1m
5.3m
7.5m
9.7m
40
36
32
32
4
80
79
68
65
7
120
119
111
93
22
160
158
133
101
18
200
183
158
120
22
240
212
180
133
40
280
248
208
151
29
320
287
241
162
29
360
320
269
176
29
400
348
295
194
40
440
377
320
216
18
478
-
345
233
18
5 ANALYSIS
The load tests show, for the ultimate load, an average skin
friction (sf) for the three piles of 21kPa (sf
1
) for the Cenozoic
sediment layer and 45kPa (sf
2
) for the residual soil layer.
From Figure 4 it can be seen that the almost total
mobilization of skin friction is for 5mm displacement..
Fellenius (2012) showed that, to mobilize the ultimate pile shaft
resistance requires very small relative movement between the
pile and the soil, usually only a few millimeters in inorganic
soils and that the direction of the movement has no effect on the
load-movement for the shaft resistance. That is, push or pull,
positive or negative, the maximum shear stress is the same.
Moreover, the movement necessary for full mobilization of the
shaft resistance is independent of the diameter of the pile.
In analyses using semi-empirical formulae, the rupture in the
pile-soil contact area was assumed. As the soil being studied
was soft sand and the piles were relatively short, the tensile skin
friction was assumed to be equal to the compression skin
friction. Poulos (2011) states that for piles in medium dense to
dense sands, this ratio typically ranges between 0.7 and 0.9, but
tends towards unity for relatively short piles, and that a
significant advance in the understanding of this problem was
made by Nicola and Randolph (1993).
Table 5 shows the results obtained in the load tests (P
Ult.PC
)
compared to those obtained from the methods employed to
predict the ultimate load of the piles (P
Ult.Cal.
).
Table 5. Ratio of the ultimate load value obtained in the load test to the
calculated value
Ratio
P
Ult.PC /
P
Ult.Cal
0.35m
0.4m
0.5m
Meyerhof and Adams (1968)
2.03
1.79
1.26
Meyerhof (1973)
0.71
0.66
0.51
Das (1983)
1.21
1.00
0.85
Martin (1966) - Univ. Grenoble
0.82
0.81
0.68
LCPC (Fellenius, 2012)
1.21
1.19
1.00
Aoki and Velloso (1975) SPT
Aoki and Velloso (1975) CPT
2.16
2.30
2.13
2.29
1.79
1.99
Decourt (1996)
1.08
1.06
0.89
Philiponnat (1978)
1.44
1.14
0.96
For the two soil layers, the average skin friction ratios for the
piles based on the results of the CPT tests are sf
1
=0.5.fs
1
,
sf
2
=0.3.fs
2
, sf
1
=0.02.qc
1
, sf
2
=0.02.qc
2
, respectively. By
expressing the ratios sf = k.fs and sf = C.qc, the values for k
demonstrated by Slami and Fellenius (1977) range from 0.8 to 2
while those for C range from 0.008 to 0.018 for sandy soils.
Bustamante and Gianeselli (1982) present the C coefficient
ranging from 0.005 to 0.03, as governed by the magnitude of the
cone resistance, type of soil and type of pile.
The LCPC Method (in Fellenius 2012), based on the
experimental work of Bustamante and Gianeselli (1982),
establishes that sf=C.qc, for bored piles in sand and with a qc of
less than 5MPa, the value of C is equal to 1/60. Given these
values, sf
1
=19kPa and sf
2
=39kPa can be computed, values
which are close to those obtained in the load tests, namely
21kPa and 45kPa, respectively.
Using the method espoused by Décourt (1996), which uses
SPT test data, tensile ultimate load values were calculated for
the three piles. According to the current suggestion of the
author, it is also necessary to use a correction coefficient (β
L
)
due to the soil being lateritic. In this case, β
L
=1.2 was used,
giving rise to the results presented in Table 3.
The method proposed by Martin (1966) and developed at the
University of Grenoble, includes various important aspects such
as cohesion, angle of friction, overload, specific soil mass and
the weight of the foundations themselves. Moreover, it is
recognized that the rupture surface forms an angle λ at the base
of the pile. In the calculations performed, the hypothesis of
angle λ equal to zero was the one which most closely
approximated the load test results.
The method proposed by Meyerhof (1973) considers
adhesion, pile-soil angle of friction, effective vertical stress and
a pull-out coefficient that depends on the angle of friction of the
soil and the type of pile. The method employed by Das (1983)
was developed for sandy soils and includes the pile-soil angle of
friction and a pull-out coefficient which depend on the relative
density of the sand, the pile-soil angle of friction and the soil’s
angle of friction. The problem with these two methods lies in
the correct definition of the abovementioned parameters.
In order to predict the ultimate loads from the load vs.
displacement curves of the load tests, the method employed was
that proposed by Décourt (1999) based on the stiffness concept
(Fellenius 2012), which divides each load with its
corresponding movement and plots the resulting value against
the applied load, Figure 5. Ultimate load prediction simulations
were performed, without using all of the load vs. displacement
curve data and it was found that, starting from 70% of the
maximum load in the test, the method presents good results in
terms of determining the ultimate load.
The average tensile skin-friction values found are close to
the values found in compression load tests with the same type of
pile in the same soil.


