 
          2708
        
        
          Proceedings of the 18
        
        
          th
        
        
          International Conference on Soil Mechanics and Geotechnical Engineering, Paris 2013
        
        
          N.B.


          n
        
        
          (bulk specific weight), w (water content),
        
        
          Gs
        
        
          (grain density), e
        
        
          (avoid ratio), n (porosity), Sr (degree of saturation), c’ (cohesion – CD
        
        
          triaxial);


          ' (friction angle – CD triaxial)
        
        
          4 PILES AND INSTRUMENTATION
        
        
          Three 10m long auger bored piles were inserted with respective
        
        
          diameters of 0.35m, 0.4m and 0.5m. The boring was carried out
        
        
          without using water. The concreting was carried out
        
        
          immediately following the opening of the holes. The simple
        
        
          compression resistance of the concrete used was 26MPa at 28
        
        
          days.
        
        
          The reinforcement of the piles consisted of two 20mm and
        
        
          two 32mm corrugated steel bars, both 10m in length.
        
        
          The instruments consisted of strain gauges at five levels
        
        
          along the depth (0.6m – reference section; 3.1m; 5.3m; 7.5m;
        
        
          9.7m). The strain gauges were connected in full bridge to 20mm
        
        
          steel bars, 0.6m long, which were screwed to the reinforcement.
        
        
          At each level along the depth, two diametrically opposed,
        
        
          instrumented bars were installed (Figure 1).
        
        
          Tell tales were also installed on the piles but these did not
        
        
          give precise readings for analysis due to the low displacement
        
        
          values measured.
        
        
          Figure 1. Instrumentation using strain gauges and tell tales.
        
        
          3 LOAD TESTS
        
        
          The load tests were of the slow maintained load type, with
        
        
          successive 40kN loads, observing the principles of Brazilian
        
        
          standard NBR 12131. The reaction system comprised root piles
        
        
          16m long with a diameter of 0.25m, for a working load of
        
        
          500kN, and four I-shaped steel beams with a load capacity of
        
        
          2MN. Loads were measured using load cell with a capacity of
        
        
          1MN and displacement was measured using four dial gauges to
        
        
          within an accuracy of 0.01mm. The ultimate loads (Q
        
        
          ult
        
        
          )
        
        
          obtained were 387kN, 440kN and 478kN respectively. The load
        
        
          vs. displacement curves obtained are shown in Figure 2.
        
        
          0
        
        
          5
        
        
          10
        
        
          15
        
        
          20
        
        
          25
        
        
          30
        
        
          0 100 200 300 400 500 600
        
        
          0,35m
        
        
          0,40m
        
        
          0,50m
        
        
          Load (kN)
        
        
          Displacement (mm)
        
        
          387kN
        
        
          440 kN
        
        
          478 kN
        
        
          Figure 2. Load vs. displacement curves.
        
        
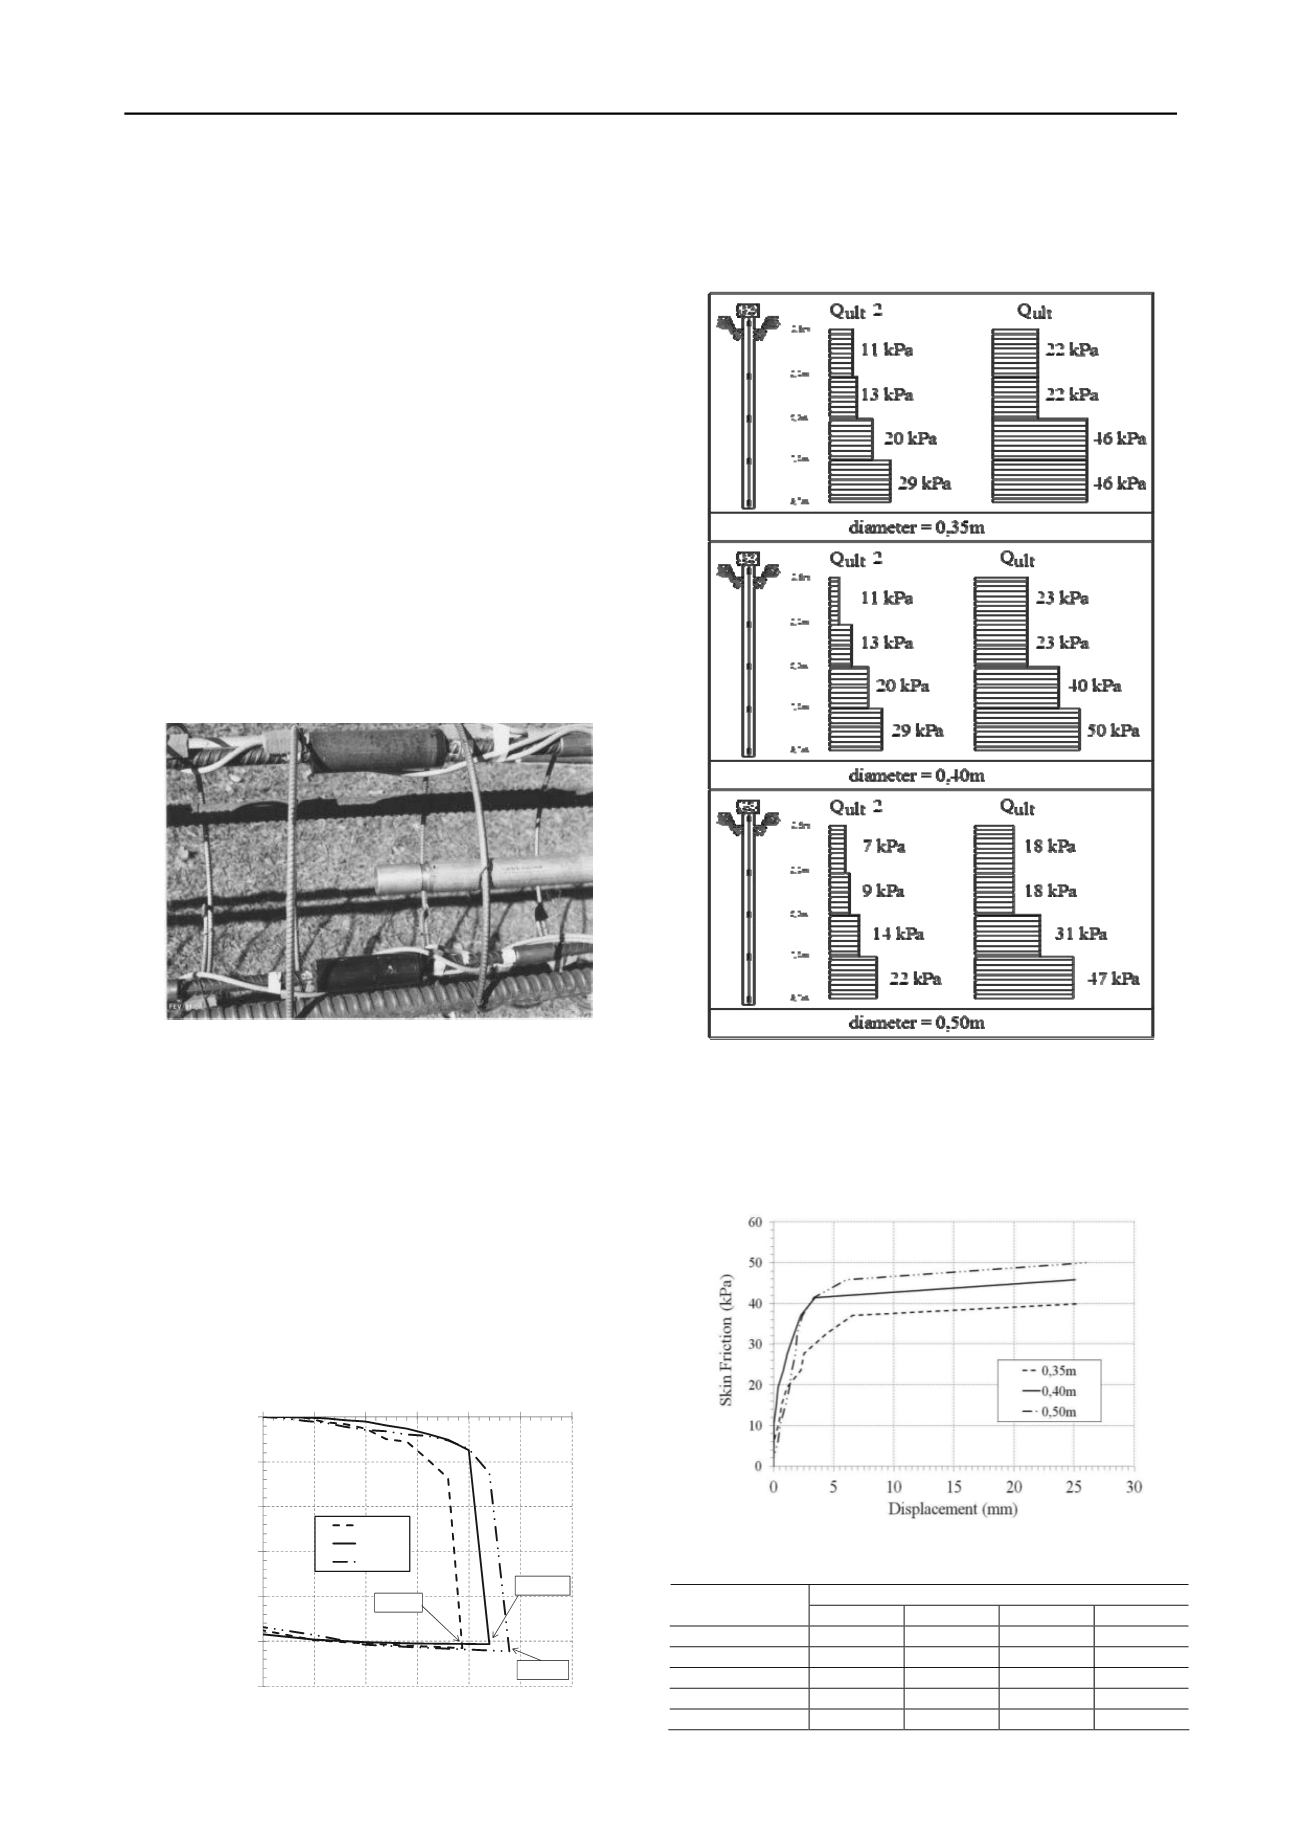
          Figure 3 shows, for the ultimate loads and working loads,
        
        
          (Qult/2) the lateral friction for each pile segment, recognizing a
        
        
          rupture in the pile-soil interaction.
        
        
          Figure 3. Lateral Friction Distribution Graph.
        
        
          Figure 4 shows the average lateral friction curves resulting
        
        
          from shaft displacement. Tables 2, 3 and 4 show the load values
        
        
          at depth for all piles.
        
        
          Figure 4. Average skin friction x shaft displacement curves.
        
        
          Table 2. Load at depth for the 0.35m pile.


            Load at respective levels (kN)


            Load at top


            (kN)


            3.1m


            5.3m


            7.5m


            9.7m


          40
        
        
          35
        
        
          29
        
        
          27
        
        
          21
        
        
          80
        
        
          76
        
        
          47
        
        
          41
        
        
          23
        
        
          120
        
        
          107
        
        
          90
        
        
          70
        
        
          23
        
        
          160
        
        
          146
        
        
          119
        
        
          80
        
        
          21
        
        
          200
        
        
          171
        
        
          140
        
        
          91
        
        
          23