3204
Proceedings of the 18
th
International Conference on Soil Mechanics and Geotechnical Engineering, Paris 2013
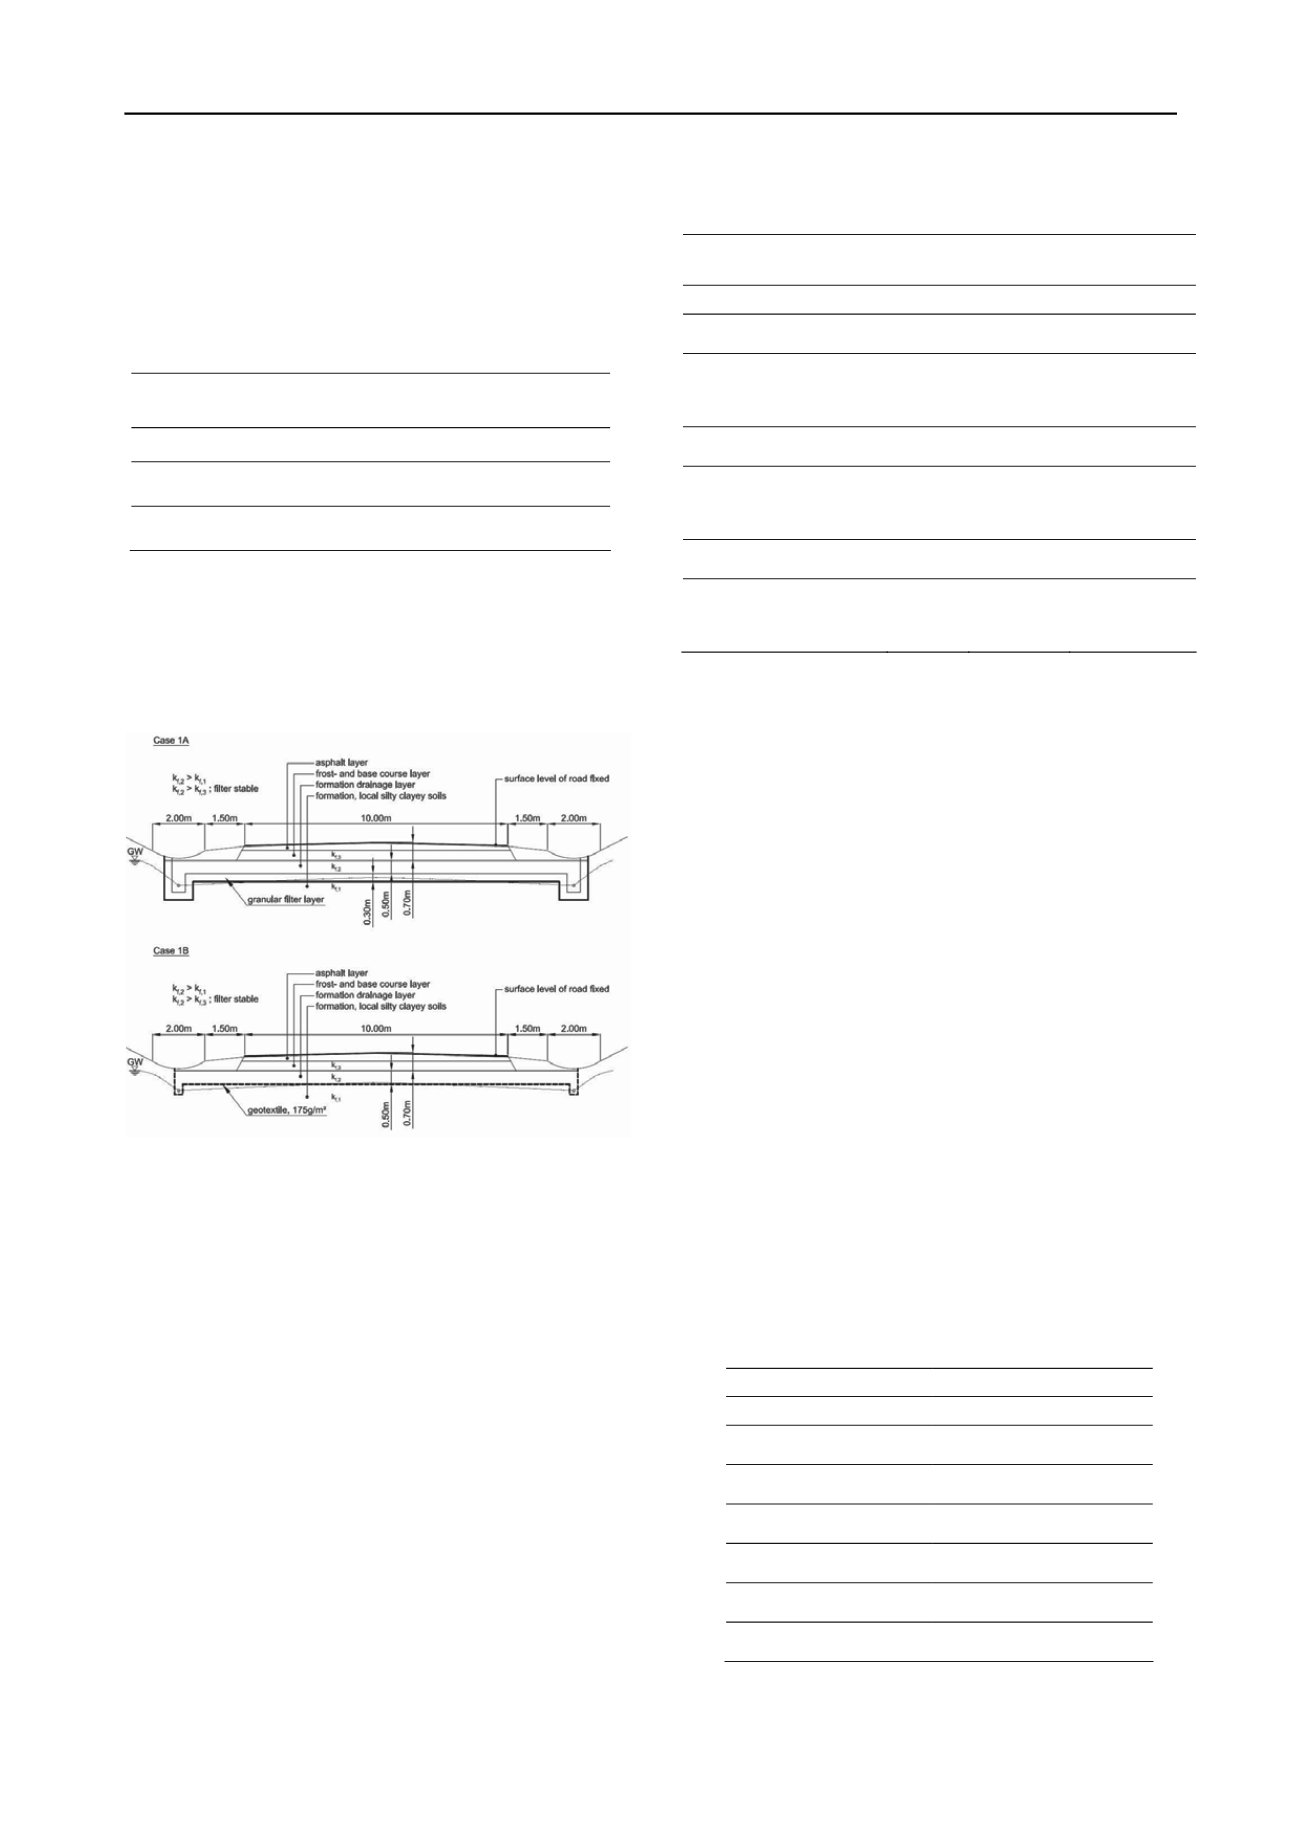
The way of the construction of the filter depends on several
factors. The basic conditions are shown in Tab. 1 and Fig. 1.
The two alternative cases compare the environmental impacts
of one square meter of the filter area below the road. The
additional excavation needed at the boundary area of the
mineral filter is not considered in the comparison.
Table 1. Design criteria of the two filter systems.
Parameter
Unit
Gravel
filter
Geosynthetic
filter
Filter size
m
2
1
1
Filtration geosynthetic
g/m
2
0
175
Gravel
cm
30
0
From these parameters it is calculated that the required
thickness D of the mineral filter is 300 mm and the one with
the geosynthetic filter layer is 1-2 mm. Fig. 1 shows a cross
section of the filter profile as modelled in this LCA.
In a sensitivity analysis the thickness of the gravel filter is
varied by +/- 10 cm.
Figure 1. Cross section of the mineral filter (top) and geosynthetic
filter system (bottom)
The functional unit in the comparative LCA is the provision
of 1 m
2
of filter with a hydraulic conductivity (k-value) of
0.1 mm/s or more and an equal life time of 30 years.
The difference between the two cases lies in the amount of
primary gravel used, the energy consumption that is related to
the filter material used (material transportation, excavation
etc.), and the use of geosynthetics. Recycled gravel is not
considered for the filter system since no onsite recycled
gravel is available when building a filter for the first time.
Some important key figures of the construction of the filter
systems are summarized in Tab. 2. The information refers to
one square meter filter and a life time of 30 years. The figures
shown regarding the particulate emissions refer to emissions
from mechanical processes (e.g., pouring, compacting of
gravel). Direct land use is not included in this LCI because
the type of land use under which the filter is being built in is
not known.
Table 2. Selected key figures describing the two constructions
f one square meter of filter
o
Material/Process
Unit
Gravel
filter
Geosynthetic
filter
Gravel
t/m
2
0.69
0
Geosynthetic layer
m
2
/m
2
0
1
Diesel
used
in
building machines
MJ/m
2
2.04
1.04
Transport, lorry
tkm/m
2
34.5
0.035
Transport,
freight,
rail
tkm/m
2
0
0.07
Particulates, >10 µm
g/m
2
4.8
0
Particulates, >2.5 µm
& <10 µm
g/m
2
1.3
0
3 MANUFACTURING OF THE GEOSYNTHETIC
LAYER
Data about geosynthetic material production are gathered at
the numerous companies participating in the project using
pre-designed questionnaires. The company specific life cycle
inventories are used to establish average life cycle inventories
of geosynthetic material.
The data collected include qualitative information of system
relevant products and processes from the producer,
information from suppliers of the producer (where possible)
as well as data from technical reference documents (e.g.
related studies, product declarations, etc.). Average LCI are
established on the basis of equally weighted averages of the
environmental performance of the products manufactured by
the participating companies.
The primary source of background inventory data used in this
study is the ecoinvent data v2.2 (ecoinvent Centre 2010),
which contains inventory data of many basic materials and
services.
In total, data from 13 questionnaires concerning the
production of geosynthetic layers used in filter applications
are included. The quality of the data received is considered to
be accurate. The level of detail is balanced in a few cases
before modelling an average geosynthetic layer.
Tab. 3 shows important key figures of the production of an
average geosynthetic layer.
Table 3. Selected key figures referring to the production of
kg geosynthetic layer used in filter applications
1
Material
Unit
Value
Raw materials
kg/kg 1.05
Water
kg/kg 2.16
Lubricating oil
kg/kg 0.0026
Electricity
kWh/kg 1.14
Thermal energy
MJ/kg 1.49
Fuel for forklifts
MJ/kg 0.09
Factory building
m
2
/kg 2.51E-5


