3205
Technical Committee 307 /
Comité technique 307
4 LIFE CYCLE IMPACT ASSESSMENT
In this section the environmental impacts of 1 square meter
filter over the full life cycle are evaluated. The life cycle
includes the provision of raw materials as well as the
construction and disposal phases.
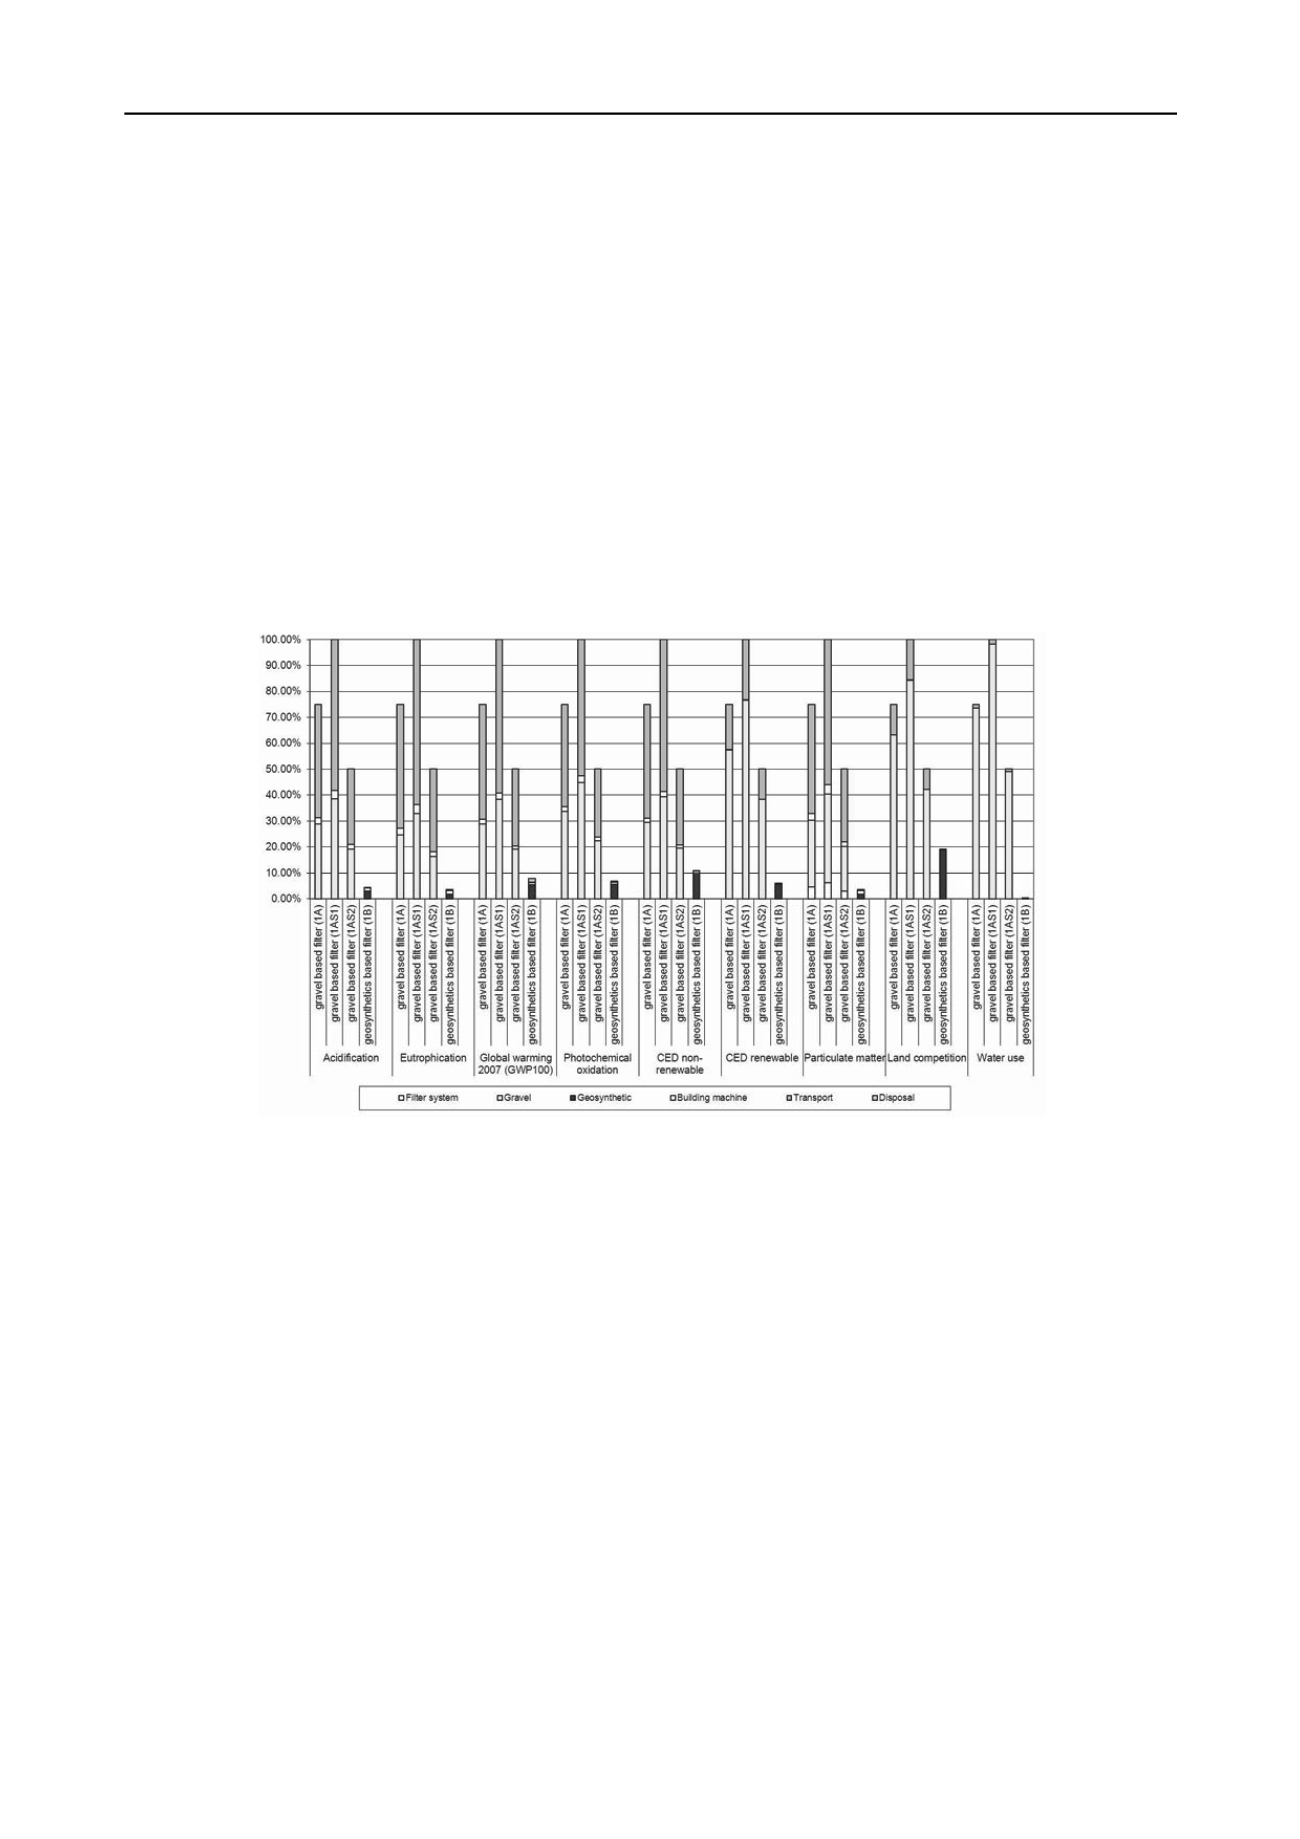
In Fig. 2 the environmental impacts of the full life cycle of
the filter are shown. The environmental impacts of the case
with highest environmental impacts (mineral filter 1AS1) are
scaled to 100°%. The total impacts are subdivided into the
sections filter system, raw materials (gravel, geosynthetic
layer), building machine (includes construction require-
ments), transports (of raw materials to construction site) and
disposal (includes transports from the construction site to the
disposal site and impacts of the disposal of the different
materials).
Fig. 2 shows that the average geosynthetic filter system (1A)
causes lower environmental impacts compared to the mineral
filter system with regard to all indicators investigated. For all
indicators the average filter with geosynthetics (1A) causes
less than 25 % of the environmental impacts of a
conventional gravel based filter (1B). The geosynthetic filter
(1B) layer causes between 0.2 % and 14.3 % of the
environmental impacts of the mineral filter layer (1A, water
use, CED non-renewable). The greenhouse gas emissions
caused by the geosynthetic filter (1B) are 10.4 % of the
greenhouse gas emissions caused by the mineral filter (1A).
The non-renewable cumulative energy demand of the
construction and disposal of 1 square meter filter with a life
time of 30 years is 131 MJ-eq in case of the mineral filter and
19 MJ-eq in case of the geosynthetic filter. The cumulative
greenhouse gas emissions amount to 7.8 kg CO
2
-eq (mineral
filter) and to 0.81 kg CO
2
-eq (geosynthetic filter).
The main source of difference is the use and transportation of
gravel. Hence, the use of geosynthetics may contribute to
reduced environmental impacts of filter layers, because it
substitutes the use of gravel.
Figure 2. Sensitivity analysis: environmental impacts of the life cycle of 1 m2 of filter layer. 1AS1 and 1AS2 refer to the sensitivity analysis with a
different thickness of the gravel based filter layer. For each indicator, the case with highest environmental impacts is scaled to 100°%.
4.1
Sensitivity analysis
In a sensitivity analysis, it is analysed how the results of the
gravel filter layer change, if the thickness of the mineral filter
is increased by 10 cm to a total thickness of 40 cm (1AS1) or
if the thickness of the mineral filter is decreased by 10 cm to a
total thickness of 20 cm (1AS2).
Fig. 2 reveals that, if a thicker filter layer is constructed, the
environmental impacts of the gravel based filter increase by
33 % and if a thinner filter layer is constructed, the
environmental impacts of the gravel based filter are decreased
by 33 %. Nevertheless, in all cases the environmental impacts
of a filter with geosynthetics (1B) are considerably lower than
the environmental impacts of a gravel based filter (1A, 1AS1,
1AS2).
4.2
Contribution Analysis Geosynthetic Production
In this section the environmental impacts of 1 kg geosynthetic
layer are evaluated. The life cycle includes the provision and
use of raw materials, working materials, energy carriers,
infrastructure and disposal processes. The category
geosynthetic in Fig. 3 comprises the direct burdens of the
geosynthetic production. This includes land occupied by the
factory producing the geosynthetic as well as process
emissions (e.g. NMVOC, particulate and COD emissions)
from the production process but not emissions from
electricity and fuel combustion.
The environmental impacts of the geosynthetic filter are
shown in Fig. 3. The cumulative greenhouse gas emissions
amount to 3.2 kg CO
2
-eq per kg.
Environmental impacts are mostly dominated by the raw
material provision and electricity consumption. Raw material
includes plastics, chemicals, printing colours, and other
additives. Plastic raw materials are responsible for between 4
% (land competition) and 80 % (CED non-renewable) of the
overall impacts, printing colours, chemical and additives for
between 2 % and 10 %.
Country-specific electricity mixes are modelled for each
company and thus impacts of electricity consumption depend
not only on the amount of electricity needed but also on its
mix. The high share of electricity in CED renewable can be
explained by the use of hydroelectric power plants in the
electricity mixes of several factories.
Heating energy and fuel consumption for forklifts are of
minor importance. With regard to land competition the
geosynthetic production plays an important role (92 % of


