3185
Technical Committee 307 /
Comité technique 307
During the basement excavation, block samples of the clay
were recovered for laboratory characterisation of the soil. These
studies examined the strength and deformation characteristics of
the clay (Ng & Nash, 1995), Table 2 and its stiffness anisotropy
(Pennington et al. 1997, Lings et al. 200). As with the field
bservations, this data informed the decisions made during the
heave inside basement
and
6)
lay geotechnical parameters
o
development of the ground model for this project as described
in the following.
Figure 4. Observations of ground
post-construction, Nash et al (199
during
Table 2. Typical Gault C
Parameter
Value
Natural moisture content: %
25 - 32
Liquid Limit, LL: %
70 - 80
Plasticity Index, PI: %
40 - 50
Liquidity Index, LI: %
0 ± 0.1
Undrained shear strength, c
u
: kPa
75+5z
(1)
Critical State angle of resistance,
'
CS
: deg
24° - 28°
Peak apparent cohesion, c'
PK
: kPa
2 - 3
Peak angle of shearing resistance,
'
PK
: deg
32° - 34°
Initial shear modulus, G
0
: MPa
80 - 120
Young’s modulus at 0.2% strain, E'
0.2%
: MPa
c. 10
(1) z = depth below top of clay
2.3
Integrated ground model
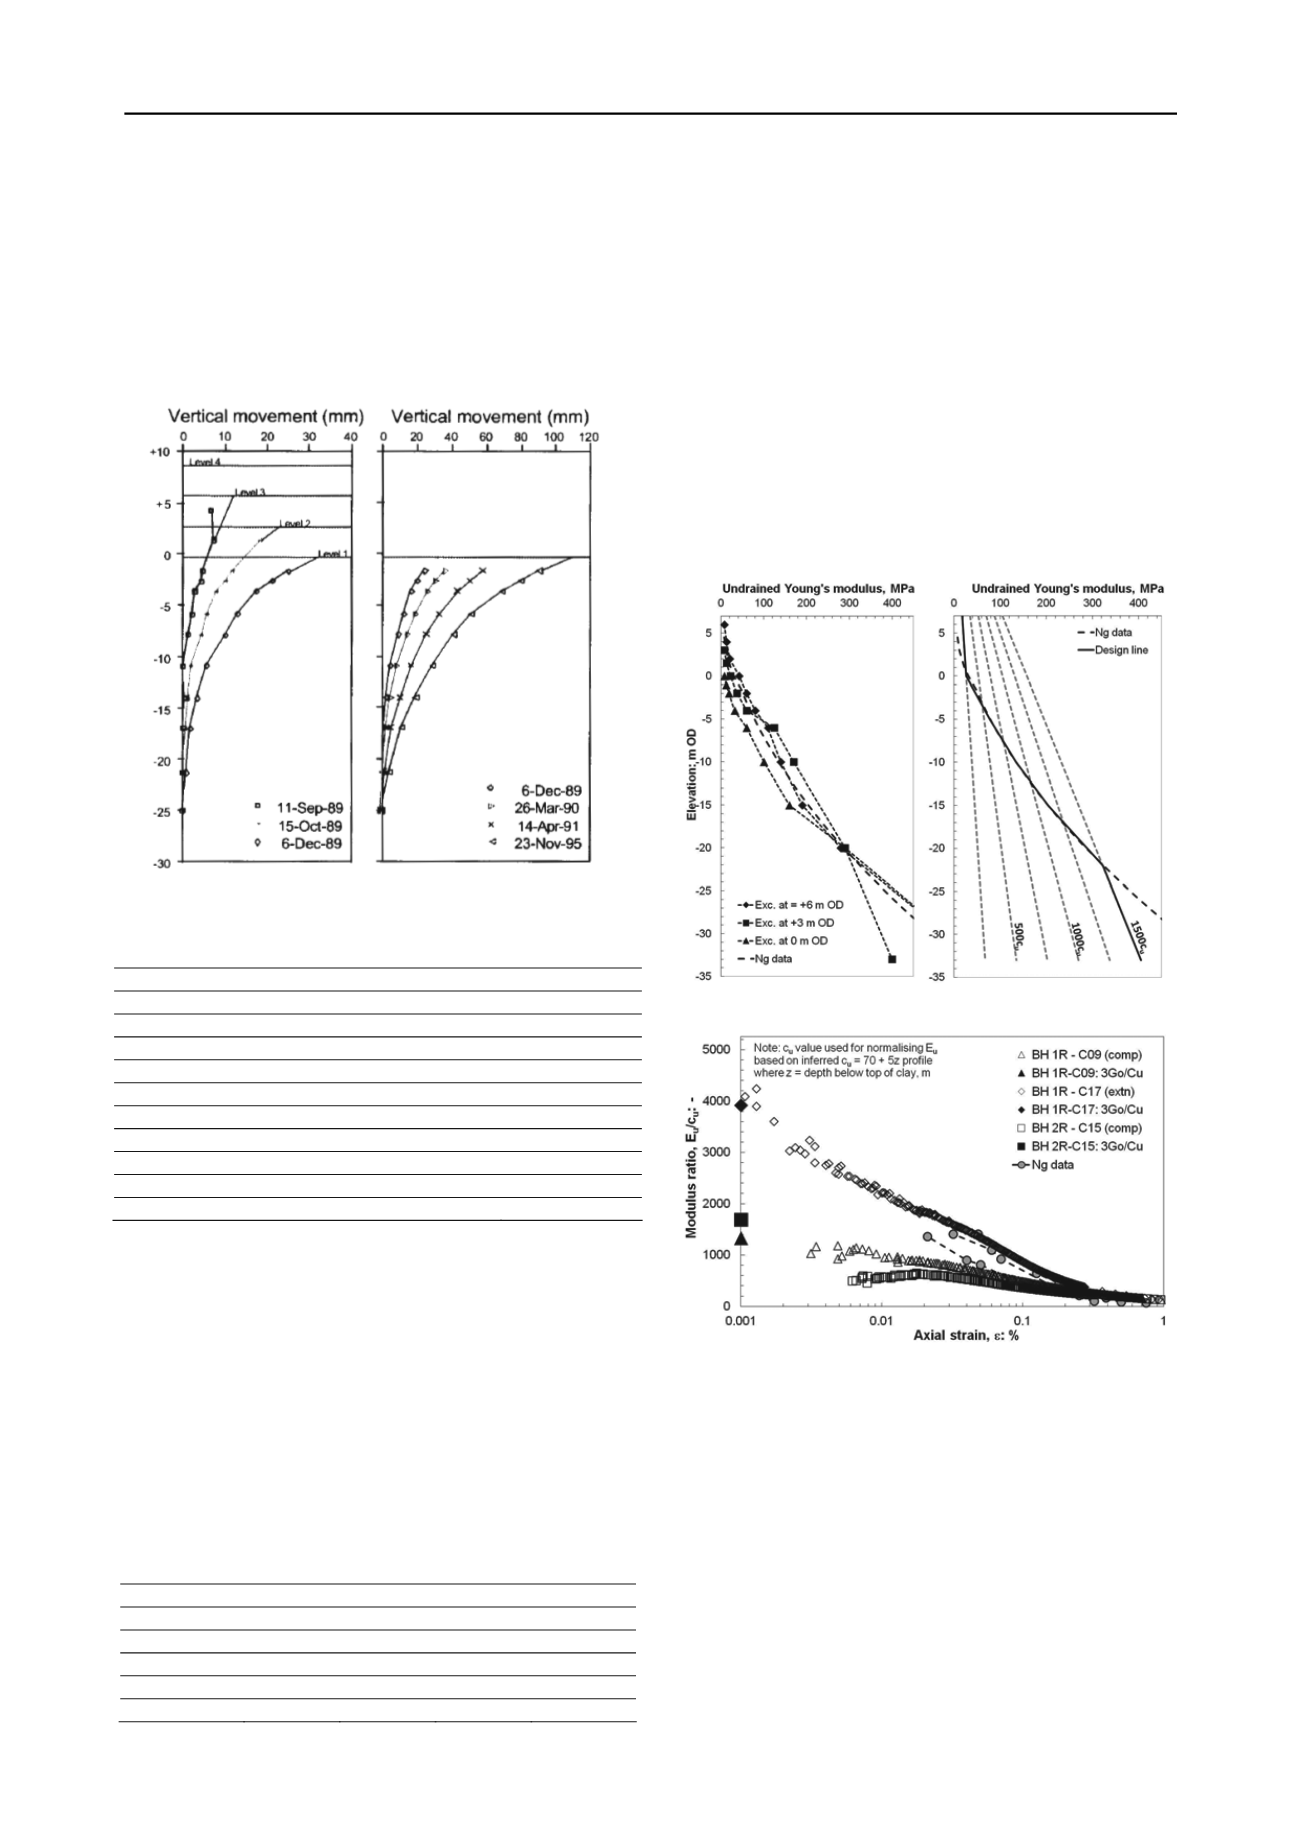
In order to undertake the geotechnical calculations for the
design of the piled raft, a ground model in terms of vertical
stiffness, E was developed based on back-analysis of the
observed heave response in the adjacent basement, Fig. 4 & 5
and stress path testing undertaken on high quality core samples
from the site, Fig. 6. Data from the latter are summarised in
Table 3.
The stiffness data from these two s
Fig. 6 – the comparison is remarkably
ources are compared in
good given the quite
c
in
f
e design of the fou n syst
mary
ss pa
ng
1
1
2
2
different sources and gave onfidence the use o the ground
model for th
ndatio em.
Table 3. Sum of stre th testi
Sample
R-C09 R-C17 R-C05 R-C17
Depth: m
11.2
25.6
10.3
19.6
G
max,i
: MPa
37.5
180
45.5
104
E
u,0.01
/c
u
: -
1000
2200
1400
1200
E
u,0.1
/c
u
: -
475
860
300
560
E
u,0.5
/c
u
: -
190
220
100
280
t-hand side of Fig. 5 where it is compared to the
‘av
low that this
as
nlinear model. Thus peak settlements were reduced
om 90 mm to 60 mm, and the area where settlements were
y
sponse from laboratory and back-
N
e latter calculation
providing subgrade stiffness values for use in the former that
The stiffness profile chosen for the design calculations is
shown in righ
erage’ line from the field data (dashed line in both sides of
Fig. 5) and various values of constant E
u
/c
u
ratio ranging from
250 to 1500.
In the preliminary design at tender stage, anticipating strains
in the region of 0.2% to 0.3%, a uniform modulus ratio E
u
/c
u
=
300 was used. It is clear from the figures be
sumption quickly becomes unrepresentative of the response of
the clay at depth and therefore any calculations are likely to
overstate the movements that might be expected.
In the design calculations, use of the linear model yielded
settlement predictions about one-third larger than that of the
pseudo-no
fr
considered excessive (i.e. greater than 40 mm), was greatl
reduced.
Figure 5. Back-analysis of ground stiffness model
Figure 6. Nonlinear stiffness re
analysed field data
3 FOUNDATION DESIG
3.1
Calculation method
A number of simplified methods have been proposed for the
evaluation of the load-settlement response of piled rafts but
often these are difficult to apply to cases where the raft shape
and/or load patterns are complex – as was the case here.
For this project, a plate-on-springs type structural analysis
was undertaken in parallel with geotechnical analysis of ground
movement using the pseudo-nonlinear elastic ground model
described above. The analyses were iterated to achieve
comparable movement predictions, th


