3189
Technical Committee 307 /
Comité technique 307
Proceedings of the 18
th
International Conference on Soil Mechanics and Geotechnical Engineering, Paris 2013
2012 for details of the filter paper method) for suctions greater
than 20 kPa. The SWCC plots of gravimetric moisture content
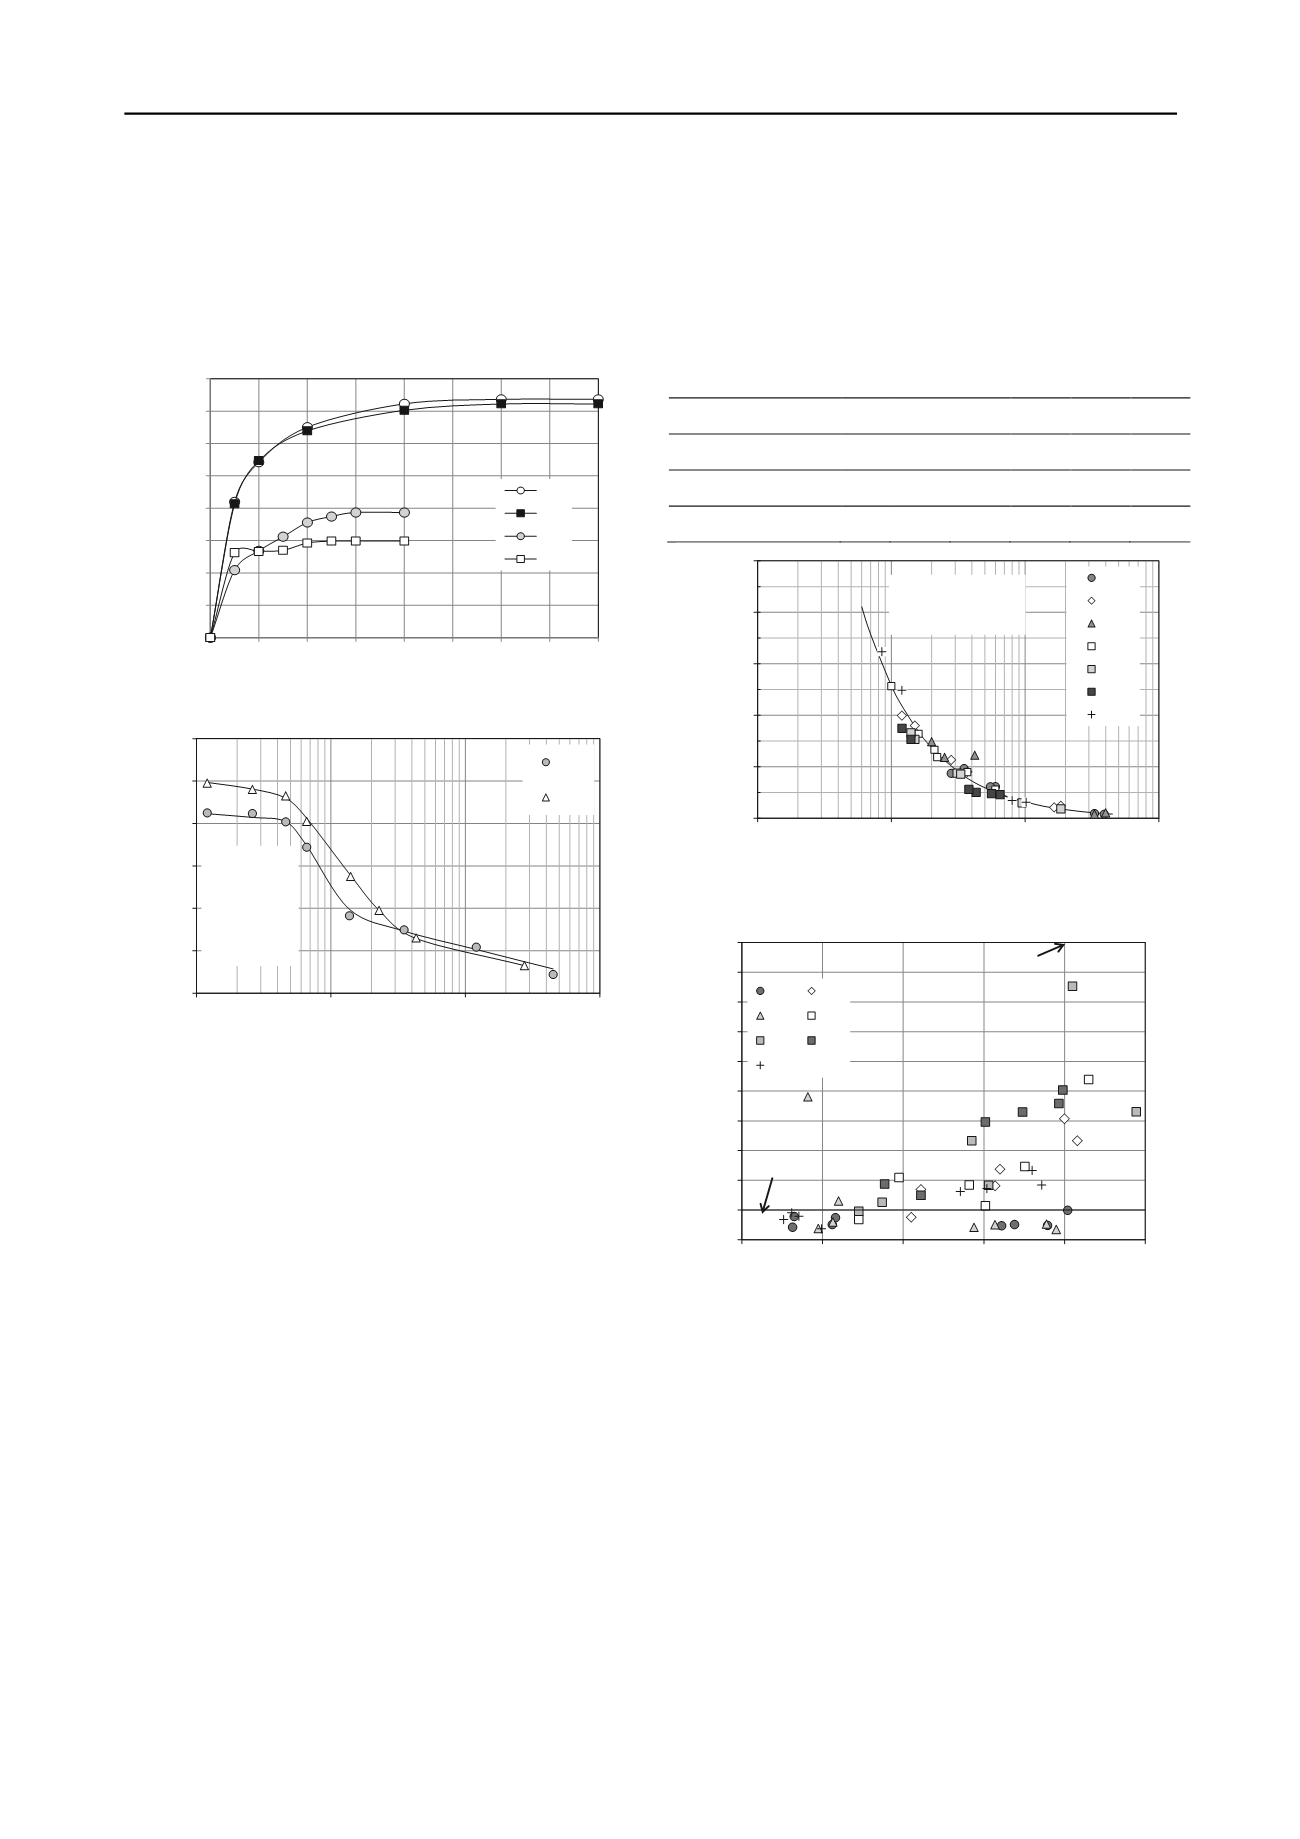
against matric suction are provided in Figure 2 for the 2 blends
with 20% RCM. Air entry values (u
ae
) were the same for these
two samples but the residual suction (u
r
) differed (15 and 30
kPa). The air entry values were within the range reported for
RCA by Rahardjo et al. 2010.
Figure 1. Shrinkage curves for the recycled materials
Figure 2. SWCC for materials A20 and B20
6 STATIC AND REPEATED LOADING RESULTS
Undrained shear strength data are indicated in Table 2 for
material prepared at a target of relative moisture content of 80%
OMC. The last row contains nominal shear strength values
based on the shear strength parameters and a normal stress of
100 kPa. The nominal shear strength decreased generally with
masonry content for the B samples, but the A samples seemed
unaffected.
Shear strength increased with matric suction or decrease of
relative moisture content. Between target moisture contents of
90 and 60% OMC, on average the nominal shear strength of the
recycled materials increased by 13%, while the quartzite
strength was improved by 9%.
The resilient modulus of the RCA products (materials A and
B) varied between 500 and 950 MPa, clearly surpassing the
DPTI 2011 requirement of 300 MPa. Generally resilient
modulus decreased with moisture content although product A
had a fairly constant modulus of approximately 600 MPa. The
materials blended with crushed masonry performed well also.
Even material B30 had a minimum modulus greater than 400
MPa. A relationship between initial matric suction and resilient
modulus from the single stress stage of the DTEI test protocol,
was developed and is illustrated in Figure 3. A simple power
model fit the data for all materials adequately. The power
function is consistent with the findings of Gupta et al. 2007.
Further work is underway on predicting the resilient modulius
from multi-stage triaxial stress testing (stress dependent model).
The DPTI specification for Class 1 material requires a
minimum rate of permanent strain over the last 30,000 load
cycles of -1x10
-8
% per cycle. RCA performance was generally
acceptable for Class 1 (refer Figure 4) although the blends with
RCM were more appropriate for Class 2 applications. The
quartzite material, Q, failed to make the DPTI Class 1 limit
when prepared at 80% OMC or wetter.
Table 2. Undrained shear strength (80% OMC)
Material
A A20 B B10 B20 B30
Cohesion (kPa)
163 134 41
9
46
0
Friction angle (
)
48 55 60 53 44 53
Nom. strength (kPa) 277 274 214 142 143 133
Figure 3. Resilient modulus as a function of initial matric suction
Figure 4. Permanent strain rate as a function of initial moisture content
7 PERMANENT STRAIN MODELLING
Gabr and Cameron 2012b proposed a predictive model for
permanent strain from multi stage RLLT data on RCA materials
A and B, and virgin aggregate, Q. Permanent strain increased
with increase in either mean stress ratio (current stress to failure
stress) or moisture content. The proposed model required mean
normal stress, shear stress ratio, number of cycles, moulding
moisture content, dry density and weighted plasticity index.
The model was found to fit very well the permanent strain
for each material. An example is given in Figure 5. It was
acknowledged by Gabr 2012 that the model attempeted to
predict permanent strain over all material shakedown ranges,
and so required further validation before confident application
to prediction of rutting in pavements.Nonethless Gabr used
finite element analysis of the impact of a single wheel load on a
thin unsealed pavement, 320 mm thick, over a sand subgrade, to
0
200
400
600
800
1000
1200
1400
1600
0 14 28 42 56 70 84 98 112
A
B
A20
B20
Shrinkage (
μ
strain)
Drying Days
6
8
10
12
14
16
18
1
10
100
1000
Water Content (%)
Matric Suction (kPa)
A20
B20
A20:
u
ae
= 5 kPa
u
r
= 15 kPa
B20:
u
ae
= 5 kPa
u
r
= 30 kPa
0
20
40
60
80
100
1
10
100
1000
A
A20
B
B10
B20
B30
Q
Initial Matric Suction (kPa)
Resilent Modulus (MPa)/ Matric Suction
M
r
/u
m
= 422.5 u
m
-0.914
R² = 0.975
-10
-9
-8
-7
-6
-5
-4
-3
-2
-1
0
50
60
70
80
90
100
Permanent Strain Rate (%/cycle x 10
-8
)
Relative Moisture Content (%)
A A20
B B10
B20 B30
Q
Maximum allowable for Class 2
Maximum allowable
for Class 1


