3147
Technical Committee 301 /
Comité technique 301
ample spectrum reflects the percent of clay size materials, as
well as the number and types of clay minerals, which vary
according to the depositional environment, humidity, depth and
amount of weathering.
0
10
20
30
40
50
60
0
20
40
60
80
Plasticity Index, IP
Liquid Limit, w
L
CL - ML
100
CH
CL
ML
Figure 3. Casagrande Chart. Wide range shown by the types of soils,
above line A.
Considering the above, granolumetric tests were carried out
with laser beam technology in the Sedimentology Laboratory of
the University of Chile with a Mastersizer 2000, determining
that the clay fraction, with a size less than 0.002 mm, does not
exceed 15%. Because it is the clay fraction that largely controls
the soil behavior, X-ray diffraction analysis was also carried out
with a crystal powder diffractometer SIEMENS D5000, in the
Crystallography Laboratory of the Department of Physics of the
University of Chile. Of two samples analyzed, two types of clay
minerals were identified: vermiculite and montmorillonite.
Vermiculite is an alteration product of biotite (mica), whereas
montmorillonite belongs to the smectite group, typically formed
by the alteration of volcanic ash. Both minerals have a large
cation exchange capacity and are expanding clays. The soils
showed clay activities between medium and high (Vásquez
2012).
Using edometric tests and classifying the samples with
reference to their sedimentary environment, one can determine
that the soils that had not suffered geological loading, have
larger initial void ratios (
e
0
) and compression indexes (
Cc
),
whereas soils with a marked glacial deformation and a history
of loading have lower
e
0
and
Cc
values (see table 1), which
directly influence their compressibility.
Table 1. Results of edometric tests, with soil samples classified by their
rigin (Vásquez 2012).
o
ID sample
Sedimentary environment
Cc
Cr
e
0
M5LS
40
Lacustrine
0.30
0.05
0.77
M5LS
20
Sub-aqueous, high
energy
0.42
0.065
1.35
Planta Lana
Fluvial inundation
0.31
0.03
1.06
Chiloé-Briceño
Basal till
0.13
0.019
0.56
Cereco
Push till
0.12
0.04
0.63
Additionally, consolidated isotropically undrained triaxial
compression tests (
CIU)
were carried out on cylindrical test
cores of 5 cm by 10 cm. These were subjected to strain-
controlled deformation with a load velocity of 0.13 %/min.
Friction angles of 22º, 26º, 30º and 35° were recorded, with
cohesions varying between 0 and 0.26 kg/cm
2
. For stratified
soils and/or those with clear sedimentary structures (troughs,
ripples), the volume of coarse fraction is that which most
influences the high shear strength, whereas the fine fraction
depends on the type and volume of clay present, reducing the
undrained strength. It is evident that the percentage of sand
and/or silt in the mixture (i.e., varved clay, overbank soils) has a
strong influence on the shear strength, which is why it would be
common to find different results in series of triaxial tests.
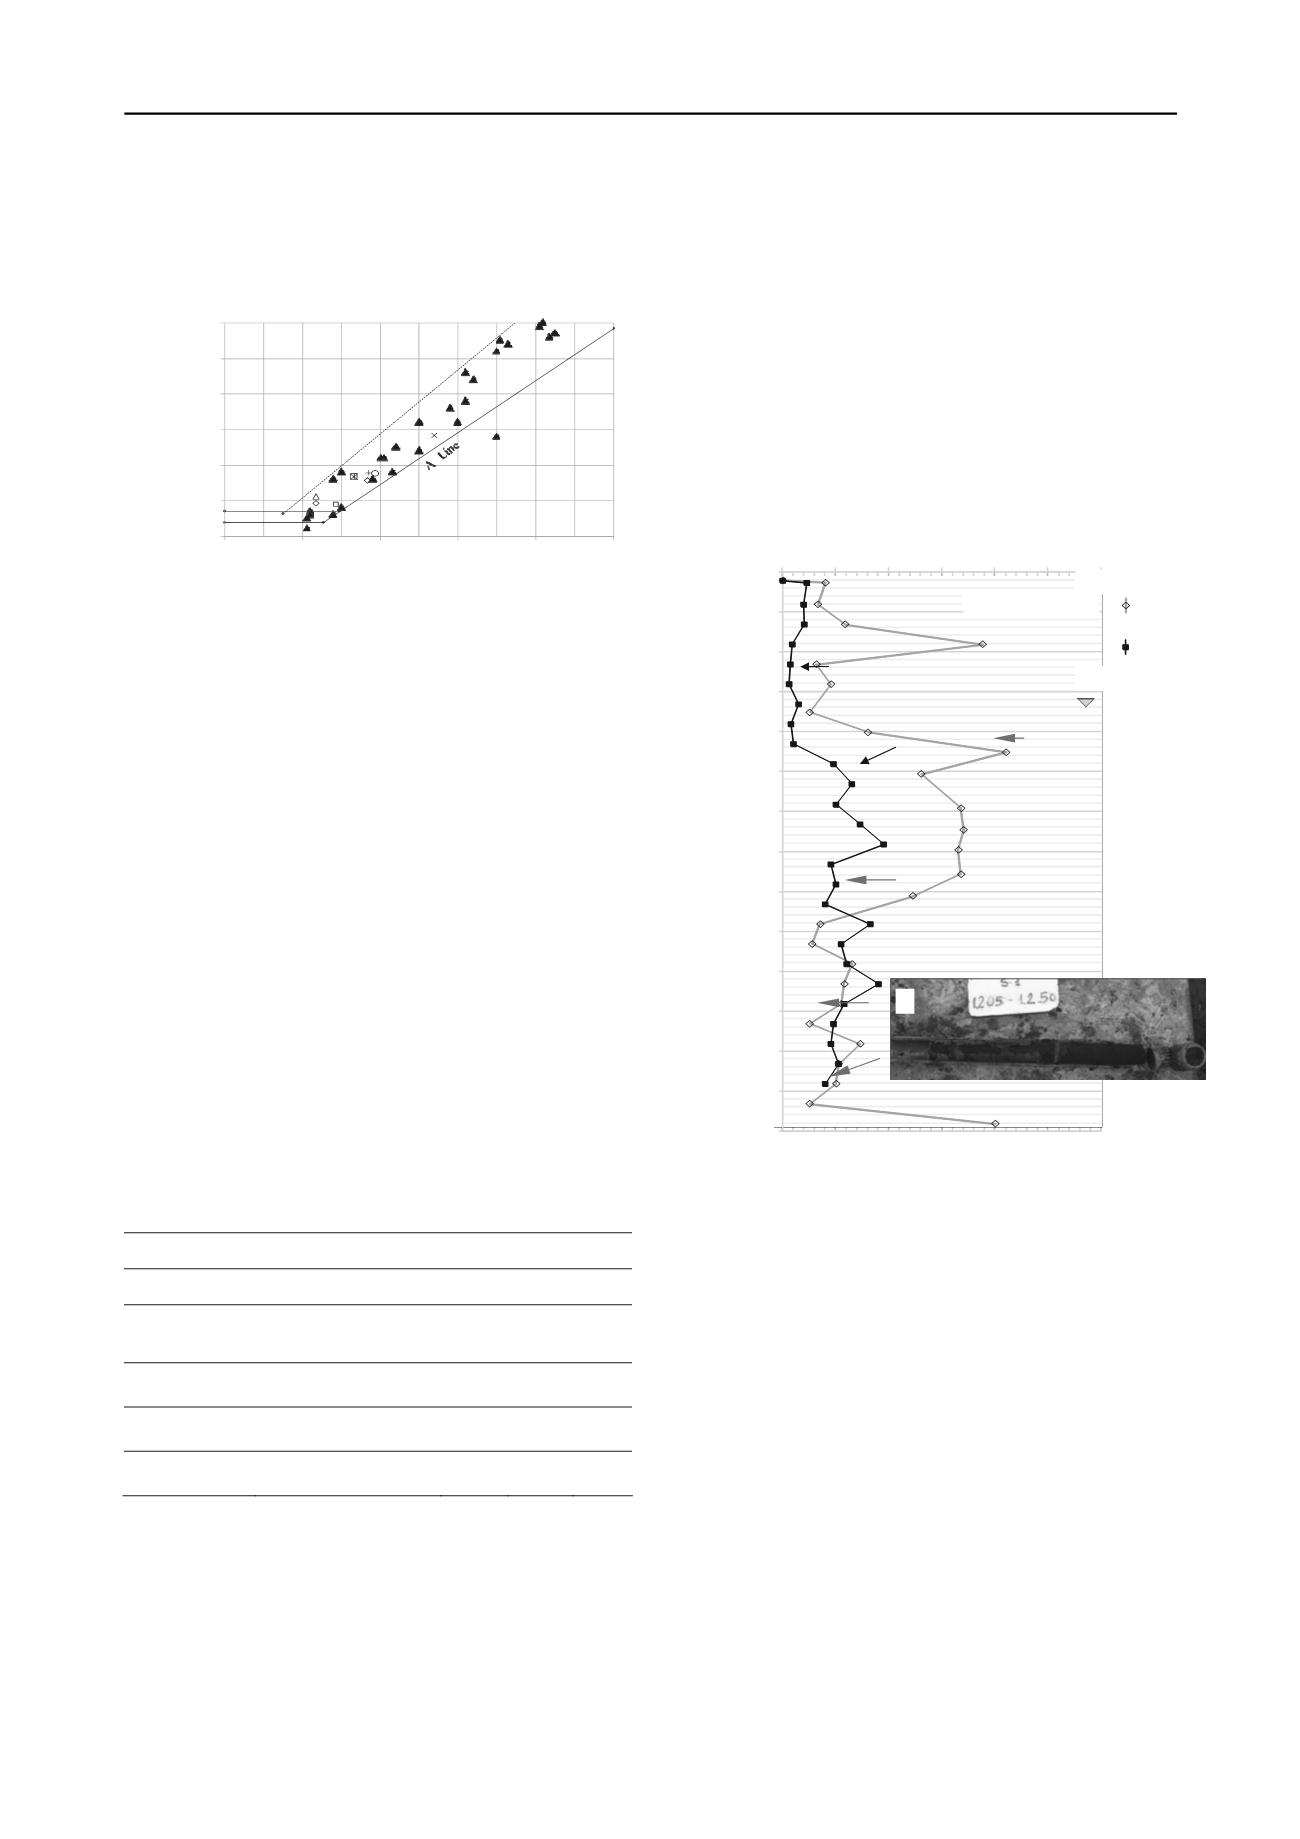
An important aspect to consider in the field is the horizontal
and vertical heterogeneity of the sediments. Figure 4 shows the
wide variation that occurs over a distance of less than 50 m in
boreholes 1 and 2. As regards the occurrence of peat at a depth
of about 12 m, it is linked to more temperate geological periods,
in a sub-basin where fine, soft sediments were deposited
together with intercalated horizons of coarse sediments (gravel,
sand).
Figure 4. Two penetration tests, S1 and S2, separated by a distance of
less than 50 m. A) Spilt-spoon sampler with peat, depth 12.0 m. (GWT)
groundwater table.
0
10
20
30
40
50
60
0
1
2
3
4
5
6
7
8
9
10
11
12
13
N
SPT_229
N
o.G
olpes
4 TENTATIVE ZONIFICATION TROUGH COMPOSITE
MAP
A composite map is the result of combining various maps of
different
types
(e.g.,
topographic,
sedimentological,
paleontological) into a single map using a single set of contour
lines. These maps accentuate parameters common in most or all
of the contributing maps, and at the same time eliminate
anomalies present in only one or a few of the latter. They can
also show details which may not be visible in any of the
contributing maps. The technique has been used in
paleogeographic reconstructions and mineral exploration (Le
Roux 1997). As applied here to a geotechnical problem, the soil
strength characteristics were combined with SPT (Szigethi
1995-2010) and stratigraphic/sedimentological data, using 57
data stations distributed throughout the urban perimeter and the
information of 110 geotechnical borehole data. The information
was unified to a depth of 4 m.
14
N
.F
S1
S2
N
.F
Depth (m)
Peat
Silty sands
.
Dense, coarse gravels.
Loose, coarse gravels.
Soft bluish grey clay, medium
plasticity, high humidity
.
A
N-SPT Number of blows
GWT
GWT
Soft bluish grey clay, medium plasticity,
high humidity
.


