3127
Technical Committee 301 /
Comité technique 301
environment for 7 days. After the curing period soil samples are
loaded to failure at a constant strain rate of 1.27 in/minute in a
triaxial compression machine.
2.2.4 Reactive Alumina and Silica Measurements
Reactive alumina and silica are the aluminum and silica present
in amorphous or poorly crystalline Al/Si phases including
amorphous alumino silicate, organically complexed alumina
and hydroxyl-Al polymers present in Montmorillonite
interlayers. Reactive alumina and silica measurements were
conducted by a procedure modified after Foster (1953). To
determine the reactive alumina and silica, 15g of soil was mixed
with 150 ml of 0.5 N NaOH and heated. Once the solution starts
boiling, heating is discontinued and the solution is allowed to
cool, followed by centrifuging at 8000 rpm. After centrifuging
the extract is filtered using a 0.1 µm membrane type filter paper.
The extract obtained was stored in a plastic bottle and the ICP
analysis was performed on a clear extract. If the extract
obtained in the last step is not clear it is treated for organics and
iron oxides which inhibit the alumina and silica measurements
in ICP analysis.
3 RESULTS AND DISCUSSON
3.1 Results of the Testing Program
3.1.1 Three Dimensional (3-D) Swell Test
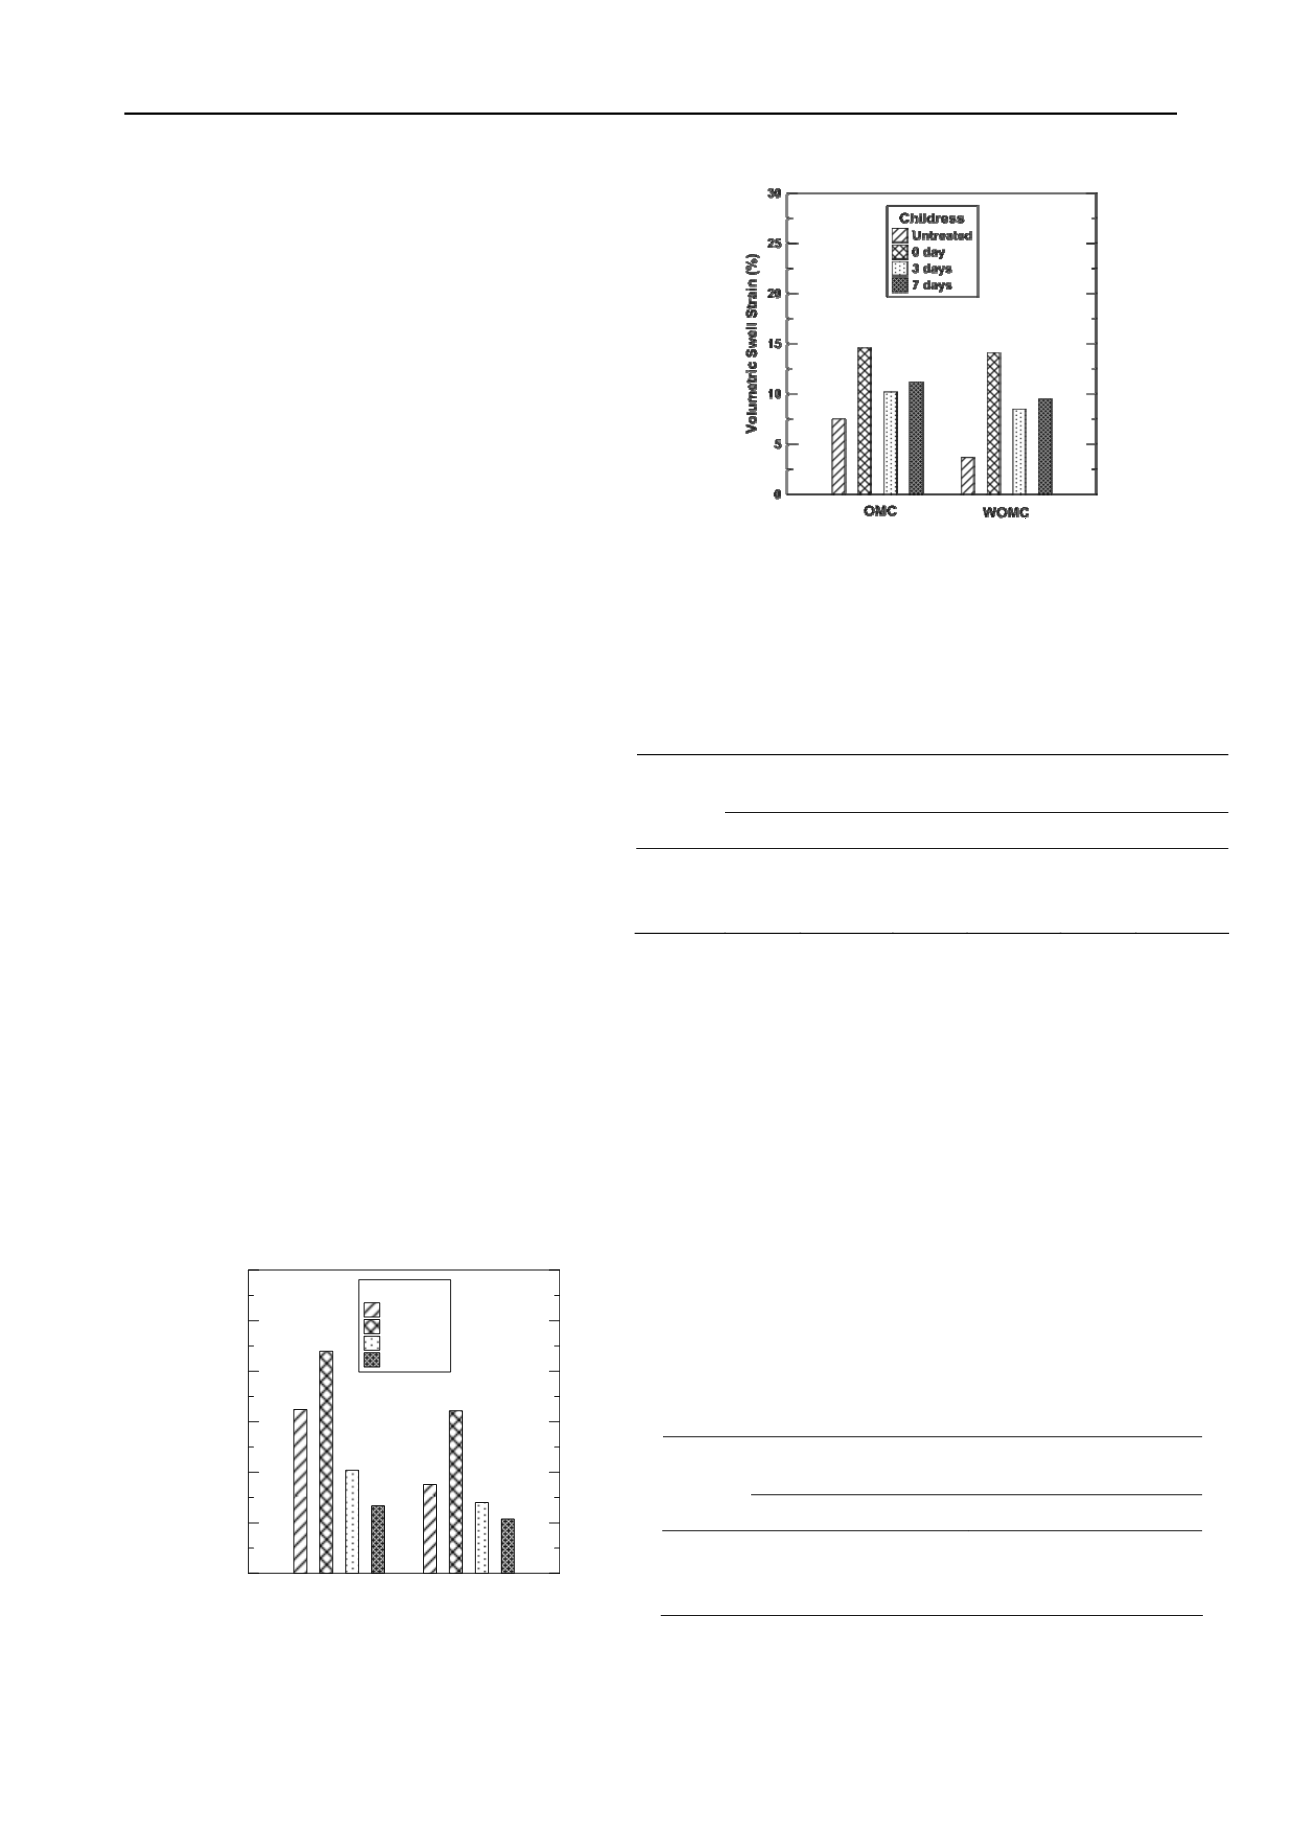
3-D swell tests were conducted on natural and treated soils as
per the procedure described above. Natural swell of Sherman
and Childress soils at optimum moisture content is 16.2% and
7.5% respectively. The observed swell is less at wet of optimum
moisture content. Additional swell tests were conducted on both
the soils at 7-day mellowing. Results of the swell testing are
presented in Figure 1 and Figure 2. It can be observed from the
figures that for both the soils at 0 days mellowing, the treated
swell is higher than the natural swell indicating the dominance
of sulfate reactions over stabilization reactions which is
common in lime treated high sulfate soils. In case of Sherman
soil, the observed swell is below the natural swell for 3-day
mellowing which further decreased with 7-day mellowing
indicating the effectiveness of mellowing in Sherman soil. In
Childress soil, with 3-day mellowing the reduction in swell is
observed though it is not significant since the treated swell is
higher than the natural swell. With 7-day mellowing, the treated
swell further increased indicating mellowing is not effective for
Childress soil. Reasons for this behavior are explained in the
subsequent sections.
Figure 1. 3-D Volumetric Swell (SHERMAN Soil)
Figure 2. 3-D Volumetric Swell (Childress Soil)
3.1.2 3-D Shrinkage Test
3-D
volumetric
shrinkage tests were conducted on natural and
treated soils at optimum and wet of optimum moisture contents.
3-D shrinkage test results are shown in Table 2.
Table 2. 3-D Shrinkage Test Results
Natural
6%L, 0 day
mellowing
6%L, 3 day
mellowing
Soil
OMC* WOMC* OMC* WOMC* OMC* WOMC*
Sherman
-15.8
-20.0
-7.6
-8.9
-6.3
-9.4
Childress -14.3
-15.4
-2.4
-2.6
-3.1
-4.0
Note*: Negative sign indicates shrinkage
From Table 2, it can be observed that volumetric shrinkage
reduced with lime treatment irrespective of the sulfate content.
Volumetric shrinkage is higher at WOMC condition owing to
the high moisture at wet of optimum than optimum. Volumetric
shrinkage of the 3 day mellowed soils is slightly higher than the
0 mellowed soils due to additional moisture provided during the
mellowing process. It can be concluded that sulfate heave
reactions do not have significant influence on the shrinkage
behavior of lime treated soils.
3.1.3 UCS Test Results
Unconfined compressive strength (UCS) tests were conducted
on natural and treated soils (0 day and 3 day mellowing). The
results of UCS tests are presented in Table 3. From Table 3. it
can be observed that UCS strengh of treated soils is 2-5 times
higher than the natural soil. There was a slight decrease in
strength in case of 3 day mellowed samples which could be
attributed to the addition of extra moisture during mellowing.
Table 3. UCS Test Results (psi)
Natural
6%L, 0 day
mellowing
6%L, 3 day
mellowing
Soil
OMC WOMC OMC WOMC OMC WOMC
Sherman
33
19 81
60 70
46
Childress
23
16 108
78 103
56
3.1.4 Discussion
Reactive alumina and silica measurements on natural (untreated
soils) and treated soils (after the samples have been subjected
for swell testing) at different mellowing periods were performed


