 
          3108
        
        
          Proceedings of the 18
        
        
          th
        
        
          International Conference on Soil Mechanics and Geotechnical Engineering, Paris 2013
        
        
          Table 1: Tensile properties of the model geosynthetics
        
        
          Table 2: Conversion of characteristic strength properties model/prototype
        
        
          (Index k: characteristic)
        
        
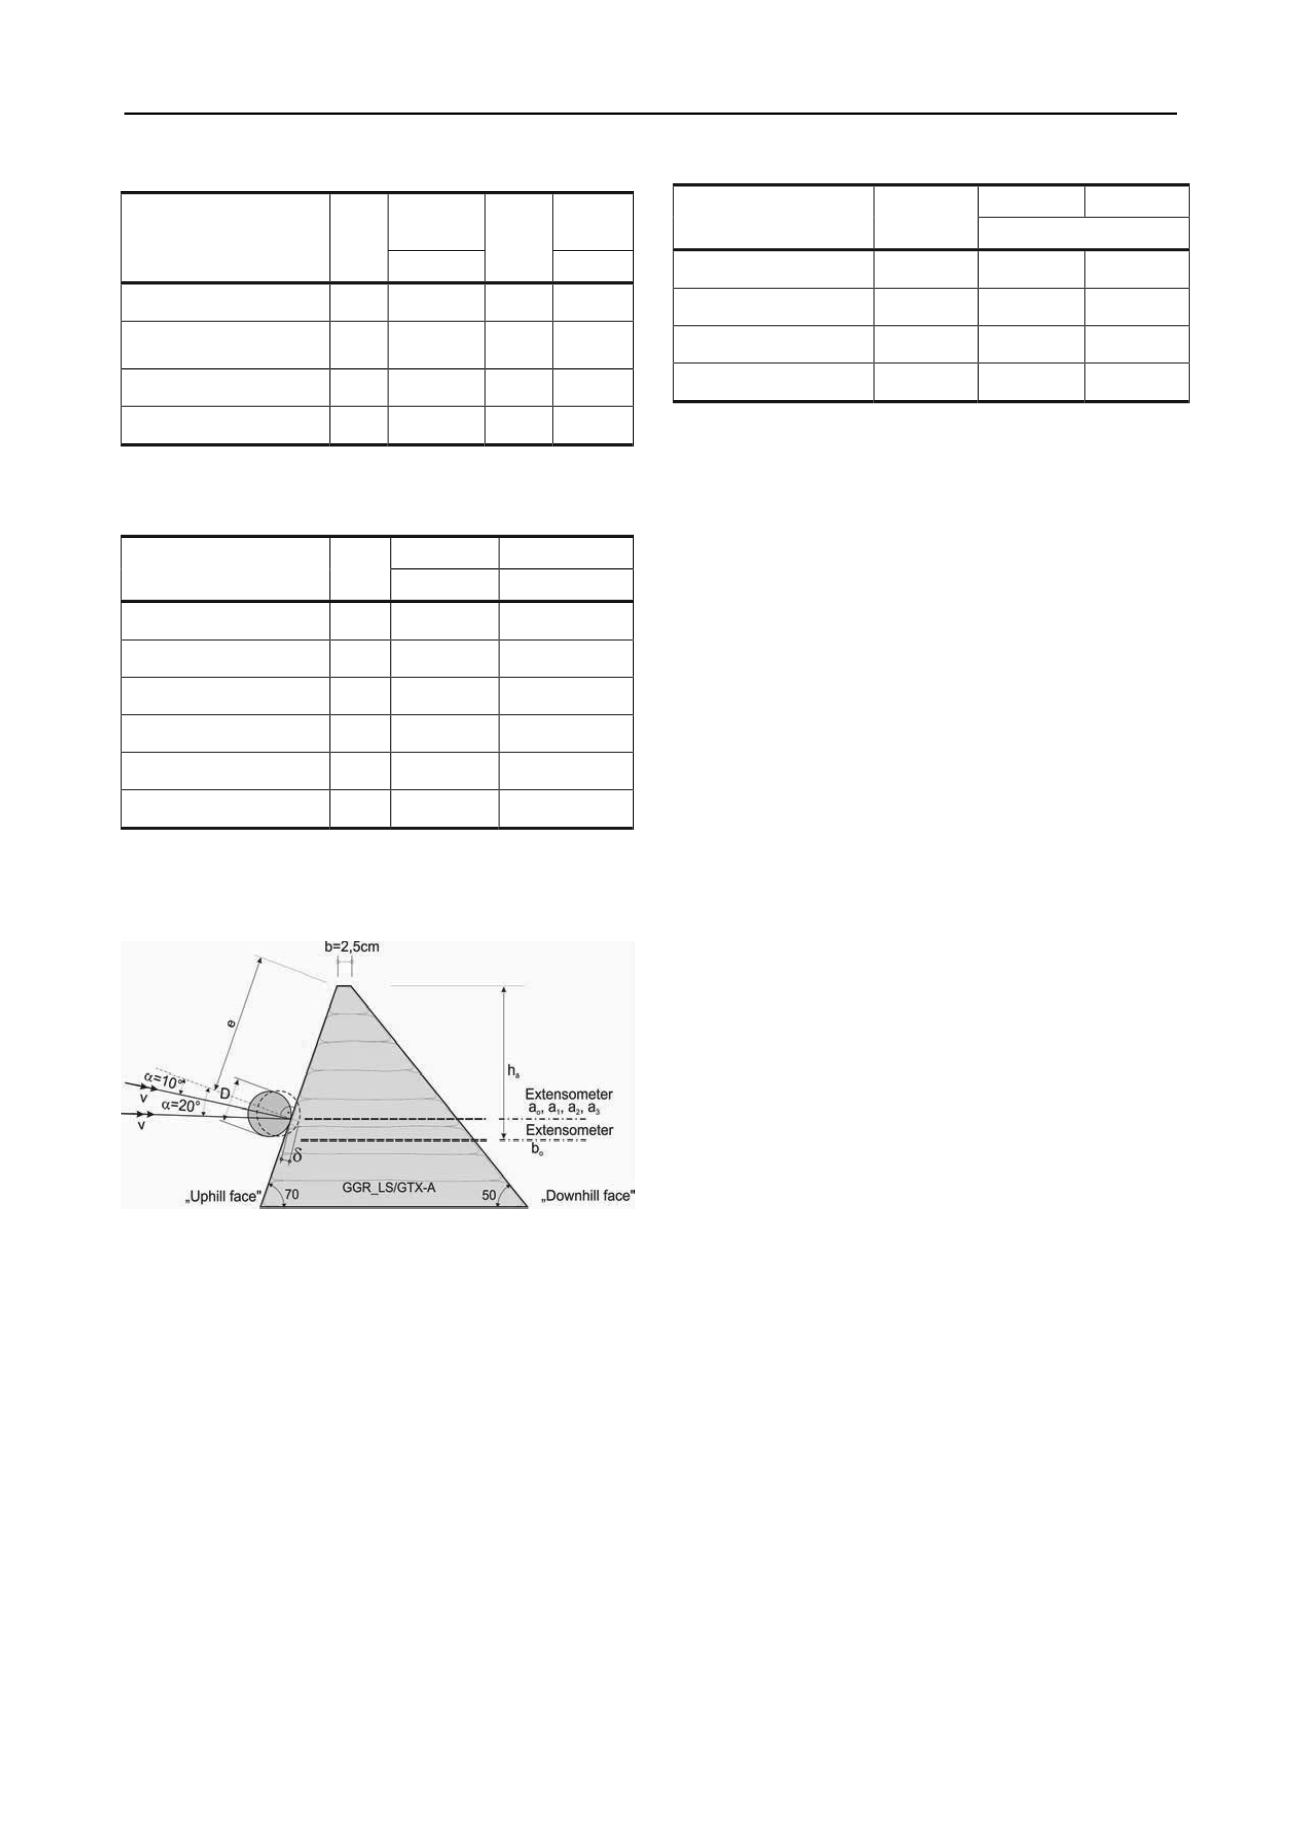
          Figure 1. Cross section with extensometers
        
        
          2.3


            Model embankments with geosynthetics


          The model embankment was reinforced with geosynthetics
        
        
          GGR_LS and GTX_A supplied by NAUE (Table 1).
        
        
          If the model laws are observed, then a line load in this model has a
        
        
          transfer factor


          ² = 33² = 1089 [-]. The characteristic values given
        
        
          in Table 2 are derived using this and equate to the full-scale values
        
        
          characteristic for the prototype.at a scale of 1:1.
        
        
          The effective tensile strengths in the model are obtained using
        
        
          a factor of A2 = 1.2 for installation damage resulting from sub-
        
        
          base placement and compaction, as are the strengths FP
        
        
          ,d
        
        
          relevant
        
        
          for the prototype after application of all reduction factors e.g.
        
        
          installation damage (Table 3).
        
        
          2.4


            Model embankments with stacked-rock facing


          In some tests, a rip rap facing was used on the uphill face of the
        
        
          embankment (Figure 2).
        
        
          F
        
        
          P,d
        
        
          J
        
        
          P,d@5%
        
        
          Property
        
        
          Unit
        
        
          Geogrid
        
        
          Tensile strength md
        
        
          kN/m
        
        
          226.9
        
        
          4538
        
        
          @ Extension


          , md
        
        
          %
        
        
          5
        
        
          -
        
        
          Tensile strength cmd
        
        
          kN/m
        
        
          127.1
        
        
          2542
        
        
          @ Extension


          , cmd
        
        
          %
        
        
          5
        
        
          -
        
        
          Table 3: Required values for reinforcement of the prototype
        
        
          (Index d: design)
        
        
          3 BASIS FOR DESIGN MODEL
        
        
          3.1


            Evaluation using relative impact energy and penetration


            depth


          In the model tests, the size and shape of the failure body created
        
        
          by the sphere were recorded. With the help of a non-dimensional
        
        
          evaluation of the test results, diagrams were drawn up to enable
        
        
          the results to be transferred to the full-scale situation, Hofmann &
        
        
          Mölk 0.
        
        
          For the evaluation, an activated soil body was defined near the
        
        
          embankment crest (Figure 3). A non-dimensional depiction of the
        
        
          results is shown in Figure 4. The relative impact energy E* was
        
        
          introduced and plotted against the non-dimensional value δ/b,
        
        
          where δ is the depth of penetration of the sphere into the
        
        
          embankment and b is the crest width. The upper extensometers (a
        
        
          0,
        
        
          a
        
        
          1,
        
        
          a
        
        
          2,
        
        
          a
        
        
          3
        
        
          ) were positioned at the mid-point of the sphere in the axis
        
        
          of the embankment; one extensometer was positioned at the level
        
        
          of the bottom of the sphere. The following variables are
        
        
          introduced:
        
        
          E*=  E / (γ * A
        
        
          a
        
        
          * D * h
        
        
          a
        
        
          ) (-)
        
        
          (1)
        
        
          E = m v²/2 (Joule)
        
        
          (2)
        
        
          γ= ρ * g (N/m³)
        
        
          (3)
        
        
          A
        
        
          a
        
        
          = (b+c)/2 * h
        
        
          a
        
        
          (activated area) (m²)
        
        
          (4)
        
        
          where E* is the relative impact energy, m is the mass of the sphere
        
        
          in kg, v its velocity in m/s (v
        
        
          1
        
        
          ;v
        
        
          2
        
        
          ;v
        
        
          3
        
        
          ), ρ the soil density in kg/m³, g
        
        
          the gravitational acceleration in m/s², D the diameter of the sphere
        
        
          in m, h
        
        
          a
        
        
          the activated height in m and b the crest width in m.


            3.2 Lessons learned from the tests


            3.2.1


            Lessons from the model tests for all construction types


          In the vicinity of the impact, the body of the
        
        
          embankment undergoes significant compaction, and the
        
        
          crest is displaced upwards.


          The slimmer the construction, the larger the failure body
        
        
          on the downhill face of the embankment.


          A comparison of the different model tests clearly shows
        
        
          the more pronounced elasto-plastic behaviour of the
        
        
          embankment reinforced with geogrids compared with
        
        
          the unreinforced case (Figure 4).


            3.2.2 Lessons from trials without rip rap facing and without


            geosynthetics


          A comparison shows how the deformations increase
        
        
          significantly from the lowest point of the sphere
        
        
          upwards. Observation of the model tests shows that a
        
        
          freeboard of at least twice the diameter D of the sphere
        
        
          F
        
        
          M,k
        
        
          GGR_LS
        
        
          F
        
        
          P,k
        
        
          Property
        
        
          Unit
        
        
          Geogrid


          Geogrid
        
        
          Tensile strength md
        
        
          kN/m
        
        
          0.25
        
        
          1089
        
        
          272.3
        
        
          Extension


          , md
        
        
          %
        
        
          5
        
        
          -
        
        
          5
        
        
          Tensile strength cmd
        
        
          kN/m
        
        
          0.14
        
        
          1089
        
        
          152.5
        
        
          Extension


          , cmd
        
        
          %
        
        
          5
        
        
          -
        
        
          5
        
        
          GGR_LS
        
        
          GTX_A
        
        
          Property
        
        
          Unit
        
        
          Geogrid
        
        
          Nonwoven
        
        
          Mass per unit area
        
        
          g/m²
        
        
          28
        
        
          39
        
        
          Thickness
        
        
          mm
        
        
          0.24
        
        
          0.25
        
        
          Tensile strength md
        
        
          kN/m
        
        
          0.25
        
        
          0.36
        
        
          Extension


          , md
        
        
          %
        
        
          5
        
        
          16
        
        
          Tensile strength cmd
        
        
          kN/m
        
        
          0.14
        
        
          0.09
        
        
          Extension


          , cmd
        
        
          %
        
        
          5
        
        
          55