2940
Proceedings of the 18
th
International Conference on Soil Mechanics and Geotechnical Engineering, Paris 2013
the monitoring data do not indicate the stability condition of the
MSE berm directly.
Several finite element models (FEM) were developed for
evaluating the stability of the MSE berm during construction
using PLAXIS® software. The soil consolidation parameters
obtained from laboratory and pilot tests were used as an initial
model calibration. These parameters were adjusted during the
initial 3-m lift placement and then used to predict pore
pressures, lateral and vertical displacements during construction
for subsequent lifts. The calibrated FEM models were used to
closely monitor the construction of the MSE berm. After
construction of each stage, the predicted horizontal and vertical
displacements and excess pore water pressure were compared to
the measured values at selected cross sections to verify
whetherthe MSE berm was performing as expected. In
addition, using ashear strength reduction method, factors of
safety (FS) at each stage of construction was estimated by the
FEM model. The procedure consisted of reducing the soil shear
strength parameters by a factor in an iterative procedure until
large displacements of the FEM model were observed. The
ultimate factor achieved represented the factor of safety against
instability using PLAXIS.Figure 5 shows an example of the
comparison between the measured and predicted pore pressures.
0.00
5.00
10.00
15.00
20.00
25.00
30.00
35.00
40.00
0
100
200
300
400
500
600
700
800
900
1000
ExcessPoreWater Pressure (ft)
Time (days)
FEMPrediction
CorrectedMornitoring
Data
Comp.
Berm
1stLift
2ndLift
3rdLift
4thLift
FS=2.21
FS=2.23
FS=2.05
FS=1.55
FS=1.80
FS=1.45
FS=1.51
FS=1.39
FS=1.30
5thLift
FS=1.63
FS=1.33
FS=1.41
6thLift
(5baskets)
FS=1.87
Figure 5. Example of monitoring results vs. predicted ones
The calculated FS at each stage of the construction are also
shown in Figure 5.Although the construction schedule was
initially established based upon estimated rates of pore pressure
dissipation using the simplified drainage model described
above, the schedule was constantly adjusted during construction
based on the interpretation of the stability condition.
The MSE berm has undergone significant deformation.A
settlement of approximately 4m was initially estimated.The
recorded maximum vertical and horizontal displacements were
approximately 4.2 m and 1.7 m, respectively.
7 BERM CONSTRUCTION
Construction of embankments designed using the HDU model
requires close interaction between the designer, the contractor,
and the owner, to allow timely geotechnical review and
interpretation of monitoring data and communication of
findings. During the initial stage of the project, it was found that
the rate of pore pressure dissipation varied by sections of the
MSE berm due to the localized subsurface geotechnical
conditions. Because of the difference in consolidation rates, the
contractor was required to alter its original construction
sequence for the berm, moving back and forth between the
different sections.By providing clarity to all parties on when
subsequent berm lifts were likely to be feasible in any particular
location, flexibility in construction task management and
minimized disruption to the overall construction schedule could
be achieved. With daily review of geotechnical data and
frequent review of finite-element modeling output prepared for
numerous berm cross sections, the designer was able to identify
areas of construction on a “just-in-time” basis for the contractor
to continue uninterrupted work. Eventually, the original plan of
building a 3m-thick lifts over 600m to 900m length of the berm
every 90 days evolved into construction of lifts in thicknesses as
thin as 1m and/or berm lengths as short as 300m, which were
patched together as review of geotechnical data would allow.
The contractor’s ability to reorganize its efforts to construct the
various sections of the berm based on week-to-week feedback
from the designer became a critical piece of the success of the
project. In this way, by August 2010, 36 months after starting,
MSE berm construction was completed. A detailed description
of the berm construction is presented by Espinoza et al (2008)
and (2011).
8 CONCLUSIONS
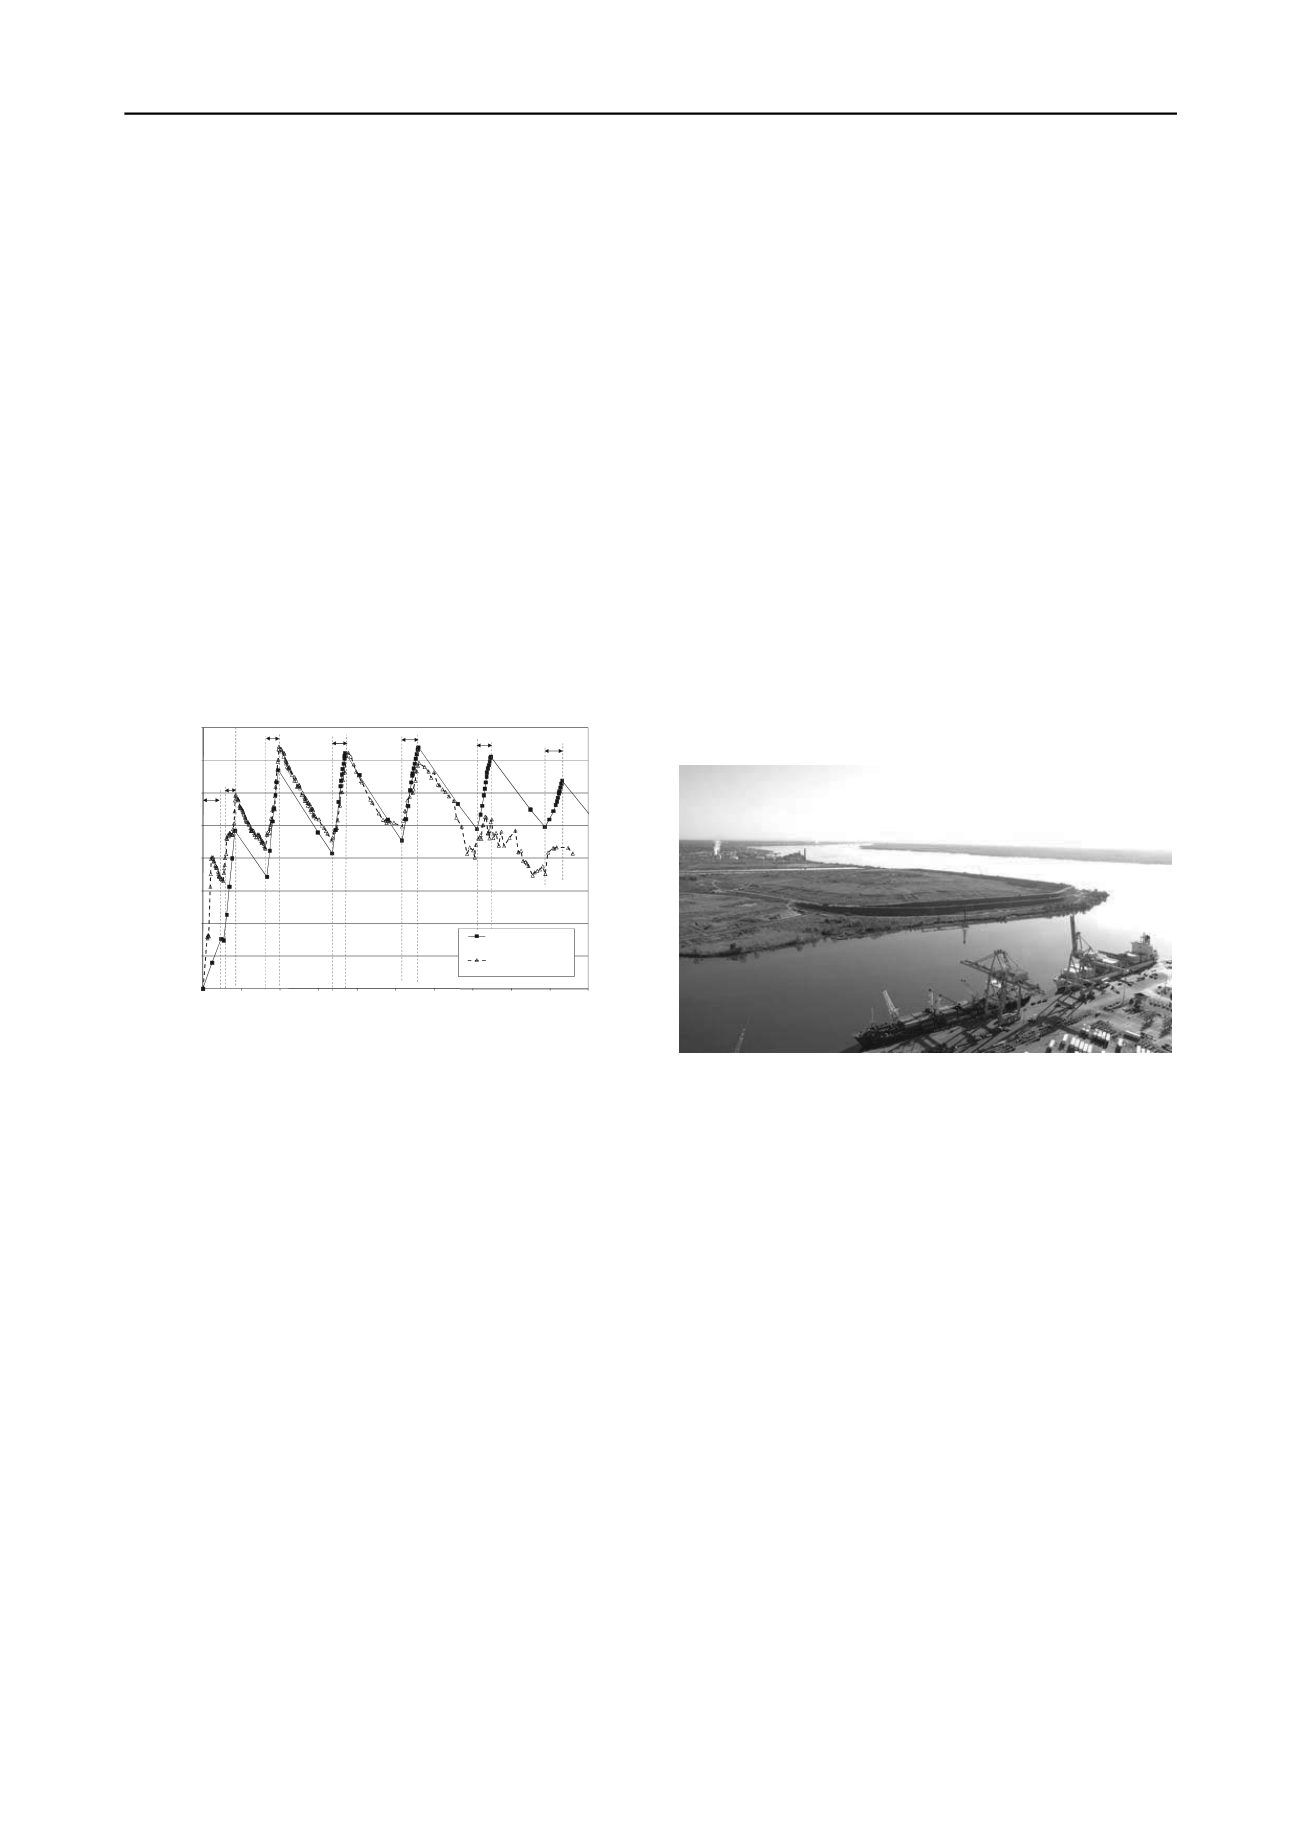
The completion of this 1.8 million cubic meters MSE berm (see
picture below) represents a significant engineering achievement
considering the size of the embankment, the deep layer of very
soft soils over which the berm was constructed, and the amount
of settlements during construction. The successful design and
construction of a 2,400m long, 21m high MSE berm over
extremely soft dredge using innovative design and construction
techniques opens opportunities not only for extending the
capacity of existing disposal facilities over dredge disposal sites
but also for very cost effectively raising levees and dykes at
critical locations prone to flooding.
Figure 6. View of Completed MSE berm
The use of PVDs at this site, which was shown to be
feasible using the HDU methodology, resulted in savings of
over $150 million when compared to conventional ground
improvement techniques such as DSM.
9 REFERENCES
Espinoza R.D., Lazarte, C.A., Germain, A.M., and Houlihan M.F. 2008.
Design Considerations for Expansion of an Existing Landfill Over
Extremely Compressible Soils.
Geo-Strata
, March-April 2008, pp.
38-43.
Espinoza R.D., Houlihan M.F. and Ramsey, T.B.Design of High Soil
Berms over Soft Soils.
Geo-Strata
, March-April 2011, pp. 52-54.
Barron, R.A. (1948). Consolidation of Fined-Grained Soils by Drain
Wells. ASCE Trans, paper 2346, V. 113, 718-724.


