2946
Proceedings of the 18
th
International Conference on Soil Mechanics and Geotechnical Engineering, Paris 2013
From (4) it may be obtained the slope at t=t* as
dS
dlogt
t
t*
2.3
4
S
T
(6)
and the settlement rate, from (4) is given by
dS
dt
S
T
t
t
t *
1
t
t *
2
(7)
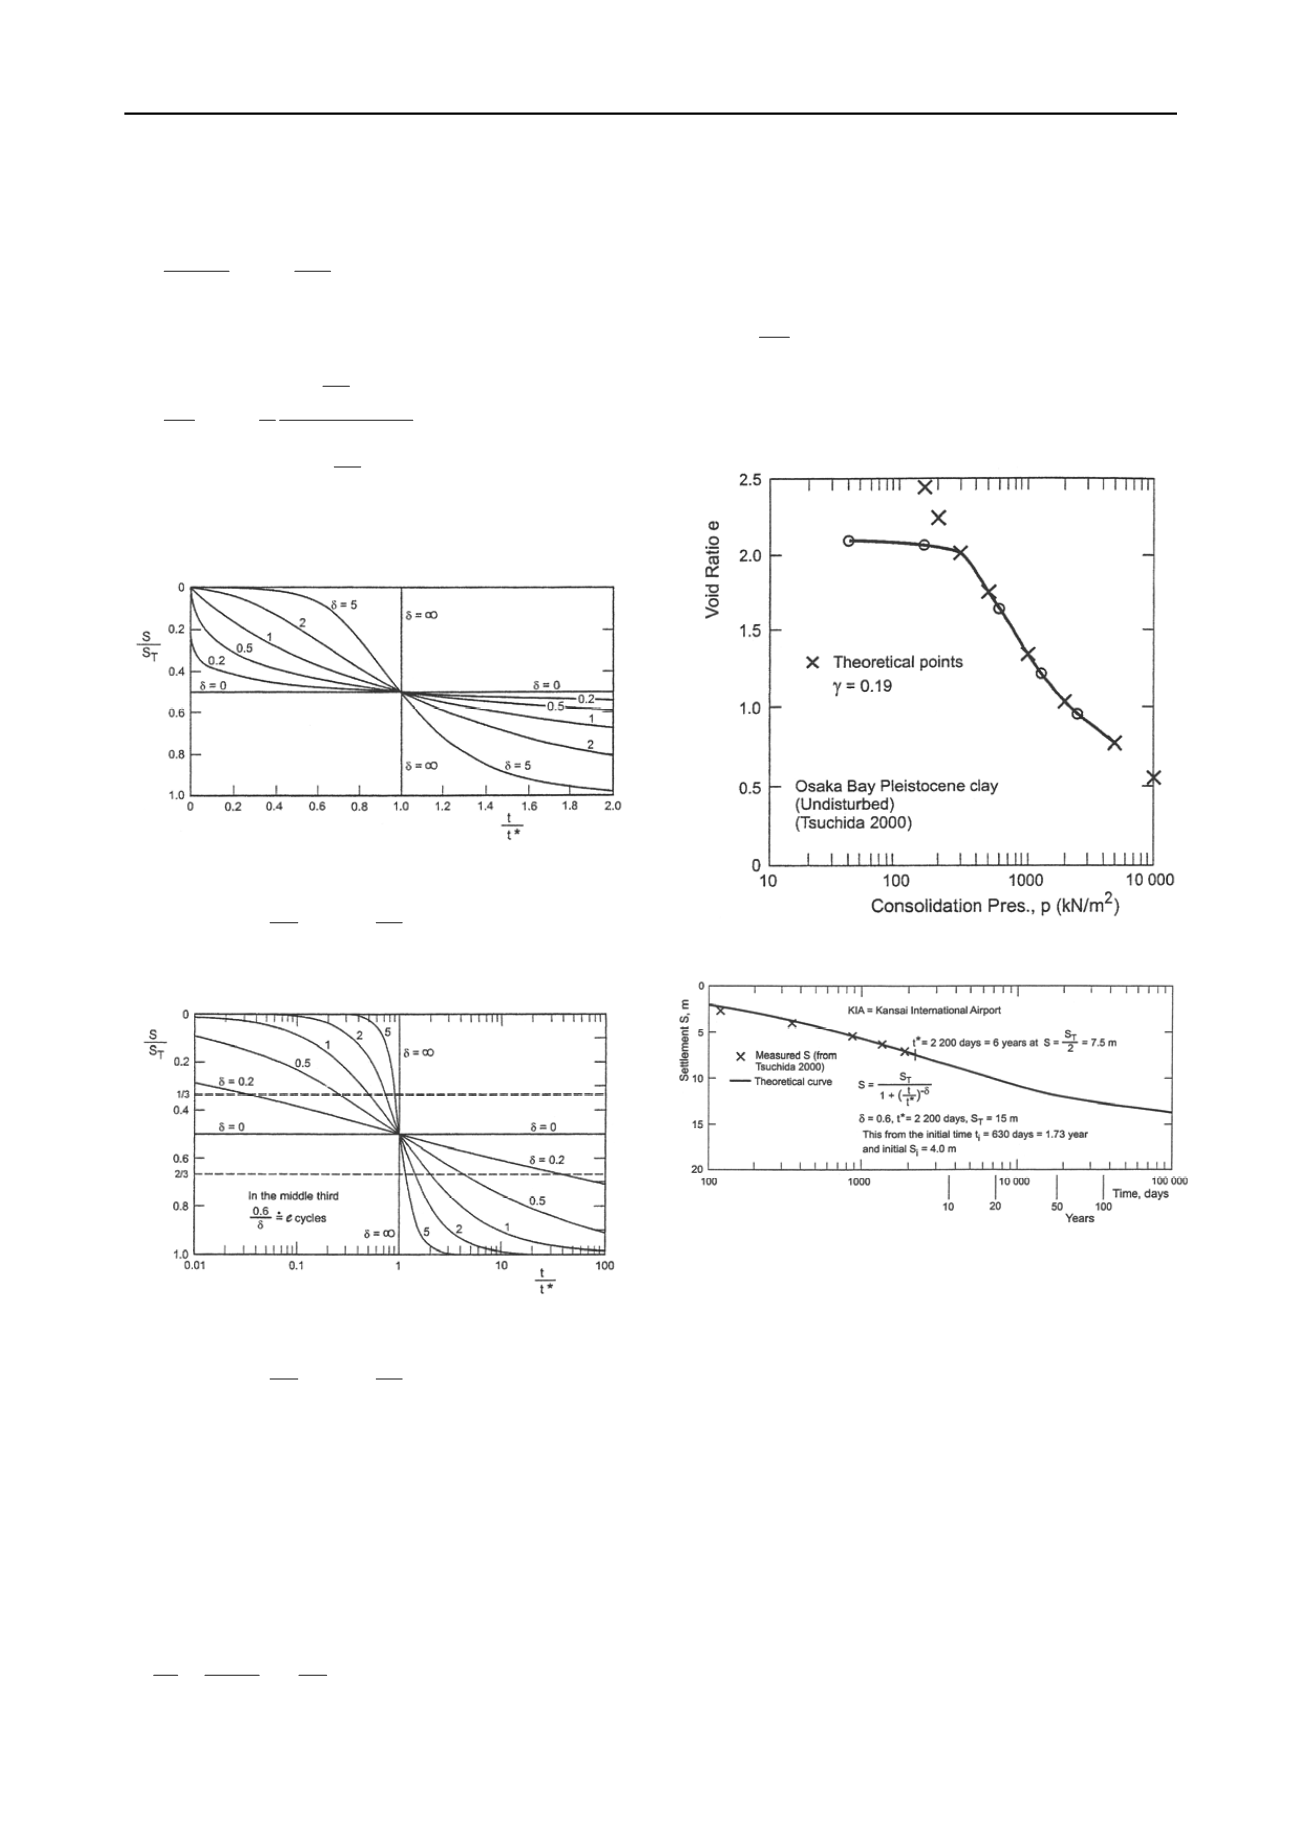
Figure 1. Graphs of
S
T
S
1
t
t *
1
Figure 2. Graphs of
S
S
T
1
t
t *
1
3
KANSAI INTERNATIONAL AIRPORT
The Kansai International Airport was built in an artificial island
5 km from Osaka, Japan (Juárez Badillo, 2005). Fig. 3 shows
the experimental compressibility curve (Tsuchida 2000) of
undisturbed Pleistocene clay to which is attributed any further
settlements. Its compressibility coefficient γ in the general
equation (Juárez Badillo 1969).
1
1
1
1
1
e
e
V
V
(8)
where γ=0.19 and (σ
1
,e
1
) is a known point. Fig. (3) shows the
theoretical points from (8). The laboratory quasi OCR=1.0-1.5
and the predicted settlement was 11.6 m calculated following
the traditional way of calculation (Tsuchida 2000). The
traditional coefficients m
v
and C
c
at any point are given by
m
v
v
(9)
C
c
2.3
(1
e)
(10)
Figure 3.e-log p curve of undisturbed Pleistocene clay
Figure 4.Settlements in KIA island
The construction of KIA started by Sept. 1987 and the opening
of the Airport was seven years later, by Sept. 1994 when the
first phase of construction was complete. During the period of
construction from about the day 530 to about the day 630 the
overburden stress by reclamation increased from about 200 to
450 kPa. By the day 1,300 the applied total load increased to
about 500 kPa (Tsuchida 2000). The author took as origin of
the final stage of construction the initial time t
i
=630 days, (when
the 90% of the total load was already in place), with an initial
settlement S
i
=4.0 m. Figs. 4 and 5 show application of (4) and
(7) to this important case. As mentioned above the origin of
time for these figures is around year 1989 and application of (4)
and (7) for the present year 2004 (t=15 years) gives a total
settlement of 9.50+4=13.50 m and a settlement rate of
14 cm/year. The total settlement at t=∞ will be
S
T
=15+4=19 m. In Fig. 5 the times from the considered initial
time, year 1989, appear in parenthesis (Juárez Badillo 2005).
Fig. 5 presents also in this paper the eight settlement rates
corresponding to the last eight years 2004 to 2011. As may be
observed they are tending towards the theoretical curve.


