2939
Technical Committee 214 /
Comité technique 214
distance from the PVD that corresponds to this value. As a
result, the dredge/alluvium materials enhanced with PVDs could
be viewed (and analyzed) as a soft soil layer enhanced with
virtual sand piles. In other words, the soil columns around the
PVDs (hereafter, virtual sand piles) develop a drained shear
strength during loading, whereas the soil outside the virtual
sand piles develops an undrained shear strength response during
loading.
u
e
= R
c
t
*
t
*
t
u
d
u
e
e
–
(
t
-
t
*)
d
u
e
d
t
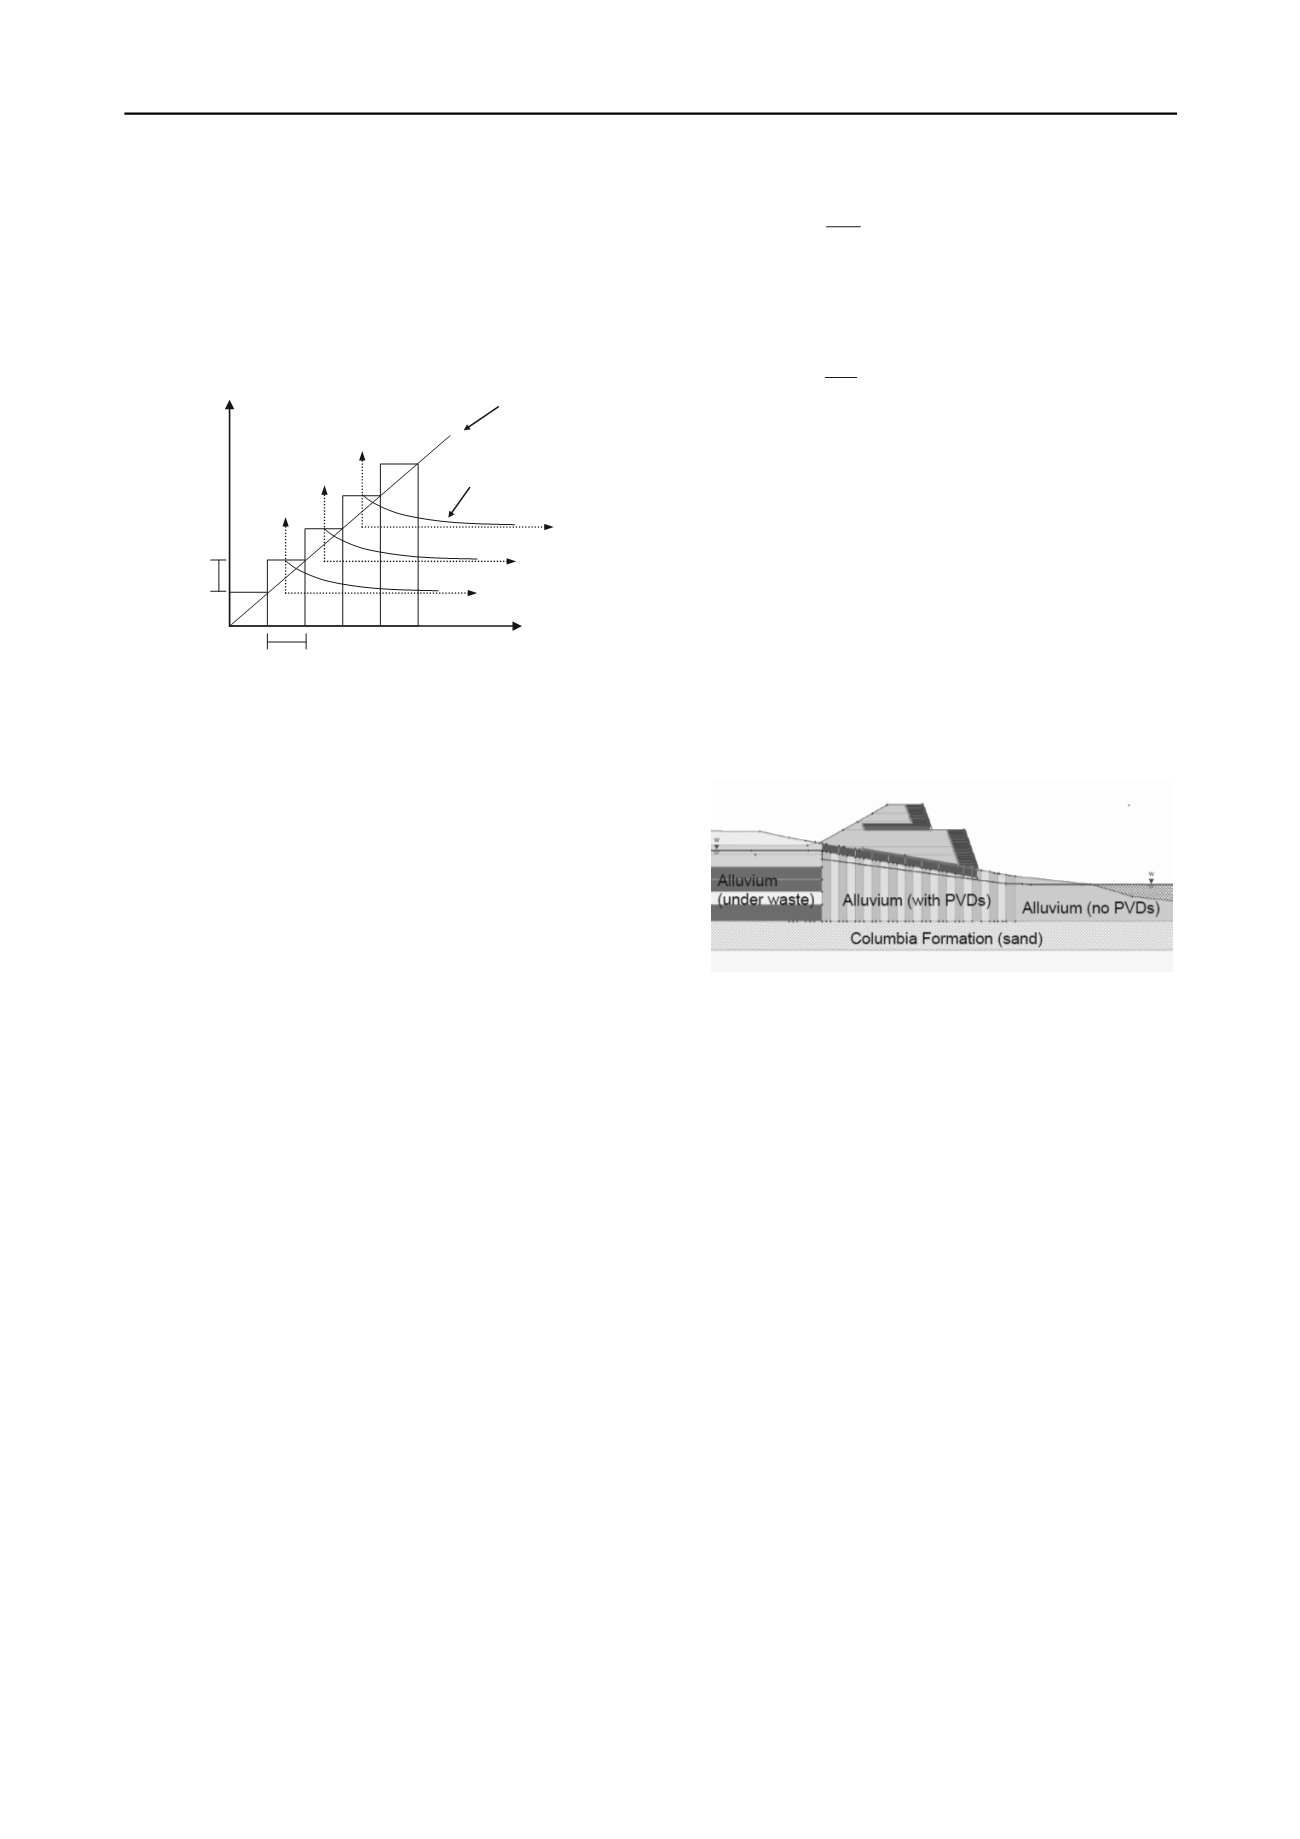
Figure 3. Pore Pressure Model
For the rate of construction (approximately 1 m of fill
placed per week) and site-specific soils at this site (
c
v
= 0.0022
cm
2
/s), approximately 1.8 million meters of prefabricated
vertical drains (PVDs) were installed at a 1.5-m spacing to
allow 90% dissipation of the excess pore-water pressures that
were generated during construction of the overlying MSE berm
within approximately 90 days. The berm was specified to be
constructed 3-m high at a time at a rate of 1 m per week every 3
months (90 days). For a fill unit weight of 19.7 kN, the initial
maximum pore pressure was 60 kPa (i.e., 6.1 m of water). For
these conditions, it was estimated that if the average pore
pressure generated within a certain distance from the PVD was
about 15% of the maximum estimated excess pore pressure, the
material could be considered drained. Based on this, it was
estimated that the dredge/alluvium located within a 46-cm
radius of the PVDs would be drained during each stage of MSE
berm construction.
5 STABILITY ANALYSIS
The main purpose of the proposed methodology was to allow
design engineers to use typical tools for analysis and design
(i.e., limit equilibrium based methods). The HDU methodology
expedited the stability analysis during the design stage as it was
readily implemented using conventional limit equilibrium
methods taking into consideration the soil strengths in the
drained and undrained zones. In that way, hundred of different
cross-sections were evaluated to optimize the design (i.e.,
minimize the MSE berm volume while still providing the same
airspace for the same factor of safety). Accordingly, for slope
stability analysis using limit equilibrium methods, the
dredge/alluvium near the PVDs was considered to be drained
with effective stress parameters given by
´ = 34º (obtained
from triaxial tests), whereas the area further away from the
PVDs was considered undrained with undrained parameters
normalized with effective overburden given by
S
u
/
´ = 0.29
(parameters obtained from an extensive cone penetration tests
and field vane shear tests). Figure 4 shows the soil stratigraphy
during construction used inlimit equilibrium analysis. As
shown in this figure, the soft dredge under the MSE berm is
modeled as vertical strips of interchanging parameters (drained
and undrained) to represent the HDU model. As shown in the
model, the width of the soil columns does not need to represent
the actual width of the virtual sand column (i.e., 0.92 m in
diameter); only the ratio between drained to undrained areas
needs to be taken into account. This can be simply estimated
as:
100
2
2
pvd
s
r
D
r
A
(6)
where:
D
pvd
is the distance between PVDs and
r
s
is the radius of
the virtual sand (1.5 m and 0.46 m for this project, respectively).
Hence, the percentage of drained area respect to the total area
for this project is:
%38 100
5.1
92.0
2
r
A
Hence, when modeling using limit equilibrium methods, as
long as the vertical strips represent approximately 38% of total
area with PVDs, the actual width of the vertical strips is
immaterial. However, the number of vertical strips should be
selected in a wayit does not have an influence on the failure
mechanism. For instance, two vertical strips would not be
appropriate. Another powerful application of the HDU model is
that PVDs outside the loaded area also have a positive effect on
stability as 38% dredge can be modeled using drained
parameters, hence increasing the overall shear strength along
the potential failure surface. As shown in Figure 4, the zone
with PVDs extended beyond the toe of the MSE berm to
increase the factor of safety against sliding during construction.
Typical design procedures would only account for the shear
strength increase due to the overburden pressure located above
the PVDs, hence PVDs outside the MSE berm footprint would
not be installed as it would not be considered in the analysis.
Figure 4. Limit Equilibrium Model of Enhanced Dredge with PVDs
In addition, to improve the stability of the MSE berm during
construction, over 200.000 m
2
of high strength geotextile was
installed at the base of the berm. The strength specified (1.170
kN/m) was one of the strongest materials ever manufactured by
Tencate at the time of construction. The proposed solution for
foundation improvement was significantly cheaper than DSM.
The total cost of installing the PVDs including the high-strength
geotextile was approximately $11 million, thus resulting in
significant savings from the initial design. Although more
engineering was required for design and construction, the total
cost was significantly less than the DSM alternative.
6 CONSTRUCTION MONITORING AND MODELING
In order to prevent unacceptably high pore pressures from
developing, construction was conducted in stages and each
stage of berm construction was limited to a 3-m thick lift
followed by a 3-month pore pressure dissipation period,
estimated initially. To monitor the performance of the
foundation during the stages of construction, data was collected
from a total of 85 geotechnical monitoring instruments along 17
lines spaced approximately 150 meters apart along the length of
the MSE berm including 51 piezometers to measure pore
pressures generated within the dredge/alluvium during loading
at three different depths, 17 settlement sensors to measure the
compressibility (i.e., vertical displacement) of the
dredge/alluvium during berm construction, and 17 slope
inclinometers at the toe of the berm to obtain a profile of
horizontal displacement with depth during loading.
Although the use of limit equilibrium analysis expedites the
analysis during design when dozens of cross sections are
analyzed during the design stage, during construction, the
recorded displacements (horizontal and vertical) could not be
used in conjunction with limit equilibrium methods. Moreover,


