2841
Technical Committee 212 /
Comité technique 212
Acceptance of seismic code requirements by the structural
design community in Hungary has been mixed; mainly due to
perceptions that seismic requirements present an unnecessary
financial burden on the builder. However, much of the design
work, when properly executed, result in very little increase in
materials and workmanship. Much of the difficulty lies in
resorting to overly-conservative design assumptions and
pseudo-static approaches that contribute to substantial increases
in materials used in standard framing design. Of course, when
viewed from this perspective, seismic design is certainly
expensive. However, if new designs are carefully applied in a
more sophisticated over-all approach, seismic requirements can
be met with less difficulty. An added benefit is that the static
design is more robust as well.
4 IMPACT OF ELASTIC PILE RESPONSE ON
STRUCTURAL DESIGN
A more flexible foundation system will generally offer lower
base shear at the cost of larger lateral deflections. What is more
difficult to quantify is the re-distribution of member forces due
to the greater component flexibility. That is, the relative
stiffness of members changes when introducing a flexible
foundation system.
4.1
Response Spectra Method
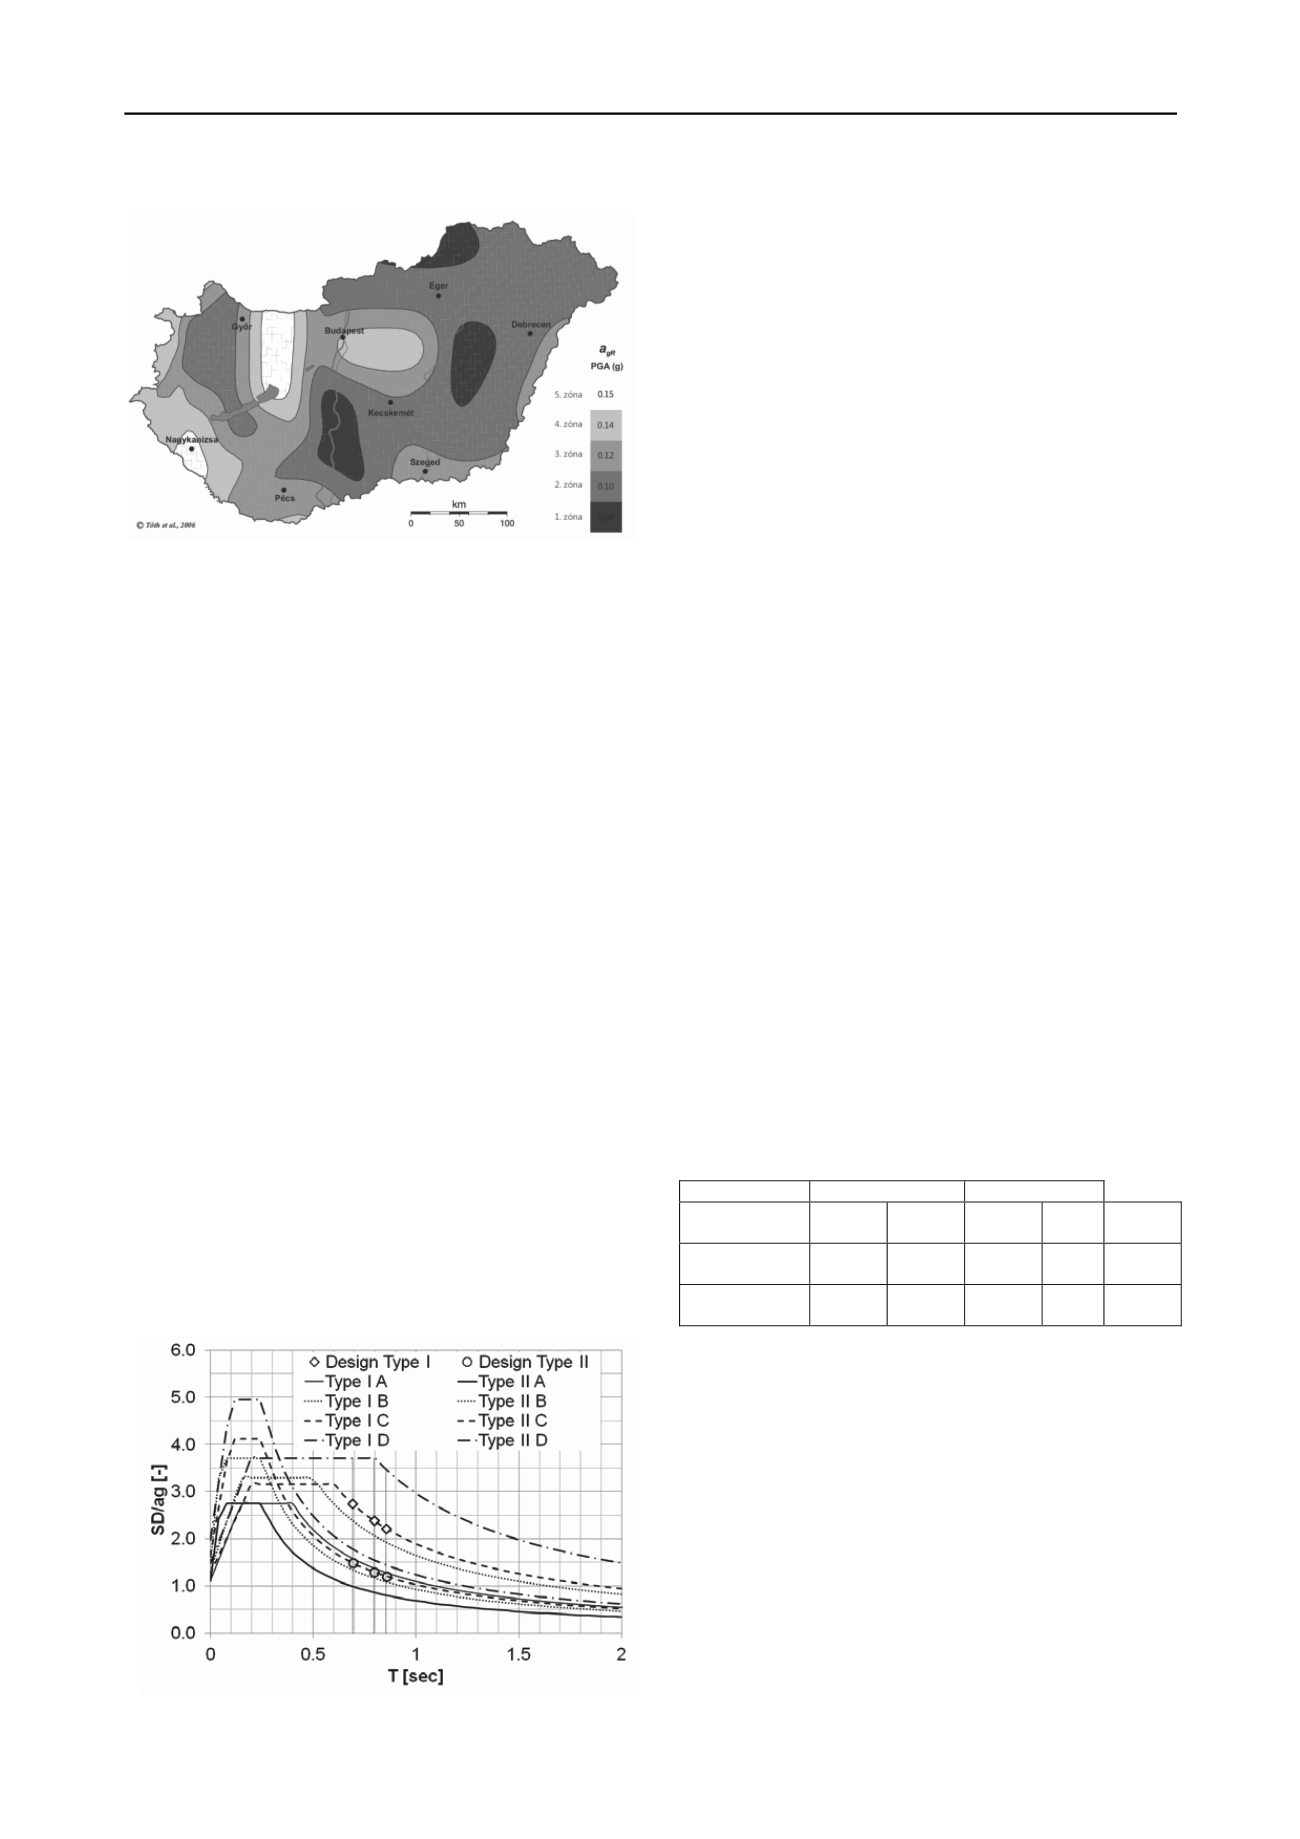
For this analysis, one of the methods used was elastic response
spectrum. The spectrum approved for use in Hungary is the
Type I spectrum (Figure 4). The two spectra are shown with
respective soil profile values. Note that the Type II lines are the
left-most of the plot lines.
Building periods were computed from EC-8 formulae
(T=0.85 sec) and modal analysis assuming fixed-base (T=0.69
sec) or spring-base (T=0.79 sec). In this range, the design
spectral values for a Type I spectra (diamond symbols) are
much higher than for Type II (circles). It is ironic that one of the
reasons for adopting a Type I curve was the perception that it
would yield lower factors and lower cost. However, for a large
percentage of buildings in Hungary, the opposite is true, as just
shown. Once the spectral factors are known, appropriate lateral
loads may be computed for simulating seismic forces.
4.2
Computing Structural Response
Load combinations were applied to the structure through
SAP2000 analysis program. Loads were based on floor and
frame masses and distributed throughout the structure. As
suggested in the software documentation (Wilson 2002) lateral
load combinations consisted of 100% lateral load parallel to the
direction of study and 30% perpendicular to it. This helps to
determine the effects of slightly non-symmetrical geometry.
Without the perpendicular loading, a feeling of false confidence
in building resistance is possible. Three loading cases were
examined based on the fundamental periods mentioned earlier:
Eurocode-8 (EC-8), SAP fixed base (SapFB), and SAP spring
base (SapSB). Since this study has a field component, most
attention was focused on the site conditions with Type C soil.
Figure 3. Five Seismic zones in Hungary showing contours of peak
ground acceleration, PGA = 0.15,0.14,0.12,0.10,0.08 Tóth et al, (2006).
In order to directly compare the difference between rigid and
spring base conditions, the structure is first analyzed under a
lateral load that was based on the distributed load from EC-8
section 4.3.3.2.3, equation 4.11. For this structure, load
increases linearly with height from 8 to 54 kN/m. These values
change with changing base shear forces computed from the
spectral values discussed earlier. There are a total of six
load/base fixity combinations presented here: 3 spectral values;
2 base fixities. While the overall maximum and minimum joint
forces changed by moderate amounts, the re-distribution of
forces was significant. Table 1 lists joint forces at the base of
the structure for 100% force applied on the long side (parallel to
the plane of Figure 2b, the y-direction in the model) direction
and 30% applied perpendicular. Average percent changes in
joint forces, related to the fixed-base condition are also shown.
Table 1. Joint reactions in rigid- and spring-base models
A comparison of forces and moments in selected members
shows that the overall seismic effect is reduced, however for
particular members, forces and moments may increase. Figure 5
presents interior column bending moments for the loading cases
discussed previously. Spring-base conditions reduce bending
moments near the base by about 30%. For higher portions of the
column, the reduction is less. The same is true to a slightly
lesser degree for the exterior columns. Since the EC8 spectral
ordinate value is the smallest, lower moments are produced. As
the fundamental period decreased for the other cases, spectral
ordinate values, and moments, increased.
The other difference in behavior is increased lateral
deflection due to the increased flexibility of the spring-base
condition. Figure 6 shows lateral displacement of the same
column and for the same loading conditions. Note that the
foundation flexibility doubles the lateral displacement for
almost all soil profiles. The slightly wavy nature of the
Spring Base
Fixed Base
Joint Rxn
Max
(kN)
Min
(kN)
Max
(kN)
Min
(kN)
Avg %
Chg
Y-direction
Reaction
430
278
443
255
20
Z-direction
Reaction
3004
556
3165
-8
30
Figure 4. Elastic response spectra.


